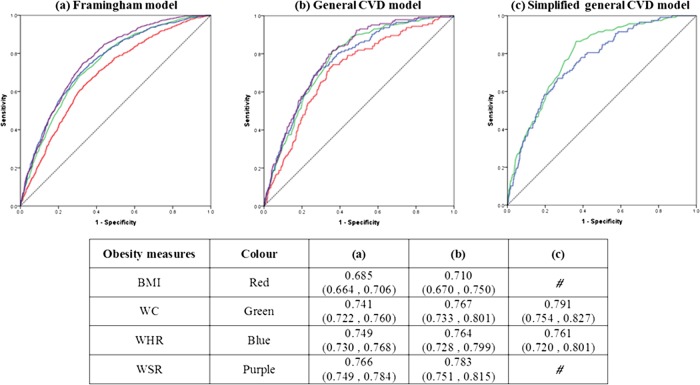
Figure 1.
ROC curves to compare the predictive ability of obesity measures for being above the 20% cut-off of three CVD models: (A) Framingham risk score model for 10-year CVD incidence; (B) general cardiovascular disease risk score model for 10-year CVD incidence and death; (C) simplified general cardiovascular disease risk score model for 10-year CVD incidence and death. #Area under the ROC curve is not calculated for this obesity measure as it contains height which is also used in the calculation of the simplified general CVD model. BMI, body mass index; CVD, cardiovascular disease; ROC, receiver operating characteristic; WC, waist circumference; WHR, waist-to-hip ratio; WSR, waist-to-stature ratio.

