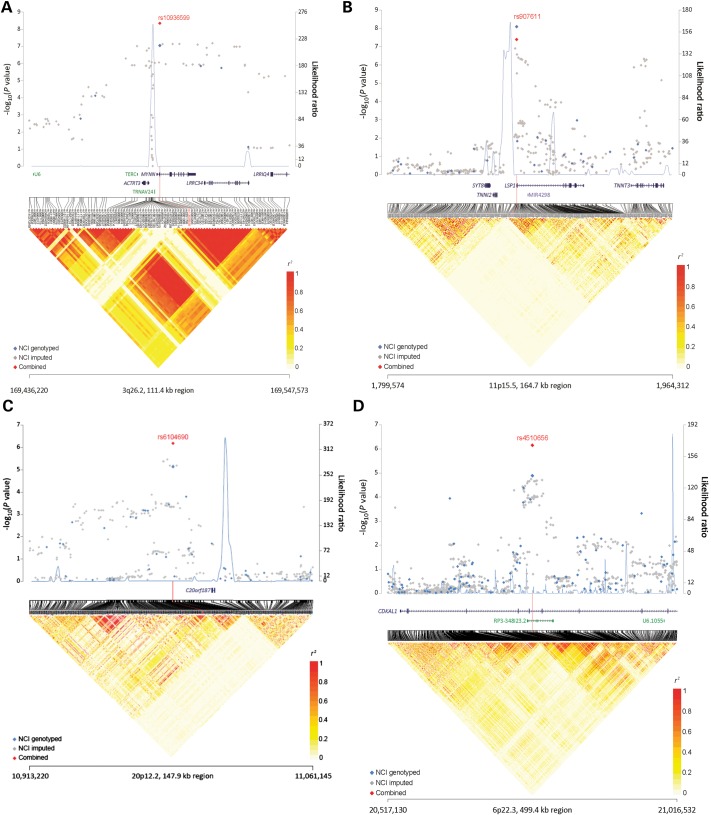
Figure 2.
(A–D) The −log10(P-value) (Y-axis) for NCI-GWAS1 and NCI-GWAS2 genotyped SNPs (blue) and imputed SNPs (gray) was plotted on the genomic coordinates (X-axis; NCBI genome build 37). The combined data for NCI-GWAS1, NCI-GWAS2, TXBCS-GWAS and TXBCS-TaqMan for four novel regions rs10936599 (3q16.2), rs907611 (11p15.5), rs6104690 (20p12.2) and rs4510656 (6p22.3) are shown in red.

