
Figure 3.
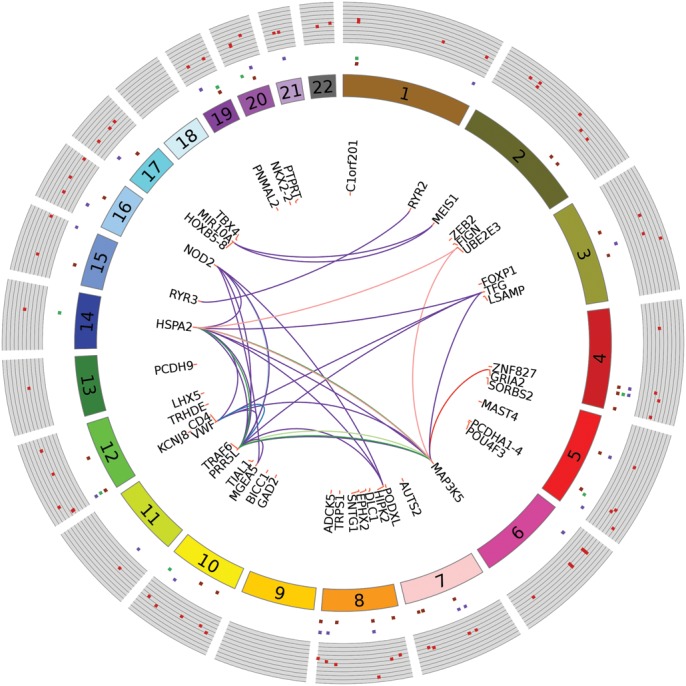
Circular plot with MWAS results and pathways/networks. Each dark-red spot in outermost track with gray background is −log10(MWAS P-value). Genomic features associated with these sites are shown by repeats (dark-purple), exons (green) and introns (orange), respectively, in the concentric circular tracks between the P-values and chromosome number. Of the 68 unique genes associated (±20 kb flaking region) with the top 70 DMRs (q-value < 0.1), the most relevant 45 genes for pathways and networks are shown. Links between genes indicate co-occurrence in pathways and protein–protein interactions networks (Table 3). Lines connecting genes in deep-purple represent protein–protein interactions. Genes co-occurring in reference pathways are linked as follows: c-Jun kinases (light blue), Downstream TCR signaling (deep blue), p38 MAPK signaling pathway (light green), MAPK signaling pathway (green), protein processing in endoplasmic reticulum (pink) and amyotrophic lateral sclerosis, ALS (red).