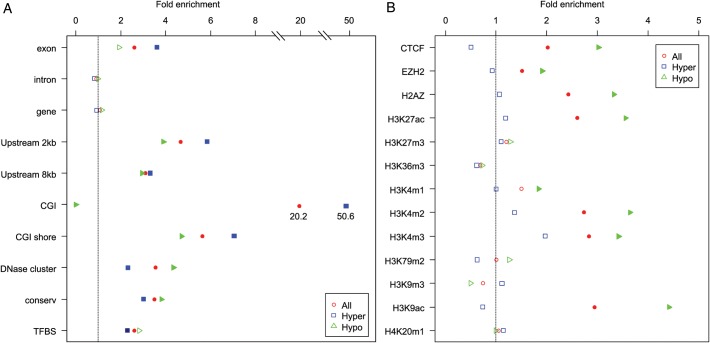
Figure 4.
Bioinformatics plot of genomic features for the top sites. The horizontal axis shows the proportion of features (vertical axis) overlapping with the top sites (q-values < 0.1). Three groups of points are plotted: red circles corresponding to all 70 top DMRs, blue squares for hypermethylated age-DMRs and green triangles for hypomethylated age-DMRs. Where enrichment compared with the genome-wide average is significant (P < 0.05), points are shown as solid color blocks. In panel A, ‘Exon’, ‘Intron’ and ‘Gene’ designate overlap with RefSeq genes; ‘CGI’ denotes overlap with a CpG island; ‘Shore’ is ±2 kb flanking a CGI; ‘Upstream 2 kb/8kb’ indicates within 2 or 8 kb upstream of transcription start site; ‘DNase cluster’ indicates a genomic region hypersensitive to DNaseI; ‘Conserv’ indicates regions of high conservation across eutherian mammals; ‘TFBS’ indicates conserved motifs for transcription factor-binding sites in humans and rodents. In panel B, ‘CTCF’ is CCCTC-binding factor protein; ‘EZH2’ is enhancer of zeste homolog 2, a histone-lysine N-methyltransferase; ‘H2AZ’ is H2A histone family, member Z, whereas the remaining categories indicate histone modifications described using standard nomenclature.

