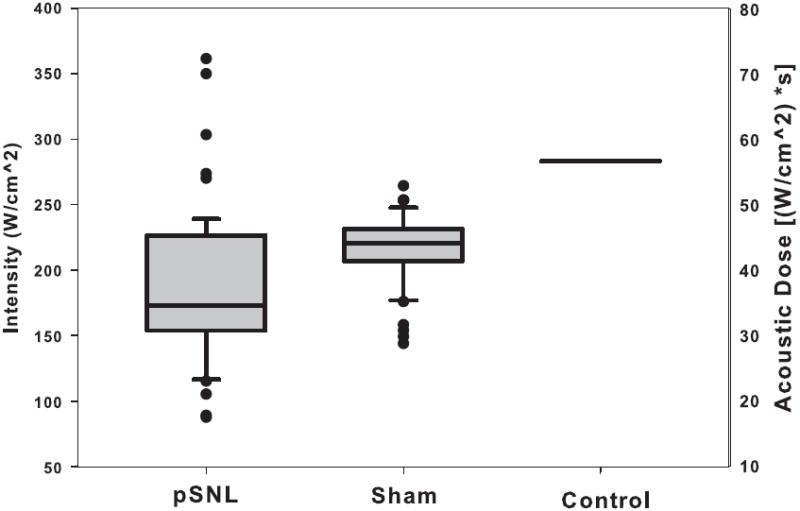
Figure 3. Paw withdrawal thresholds for pSNL, sham, and control rats.

Here we show the iFU threshold values for each group of animals, with the intensity of iFU on the left side and the acoustic dose on the right. Note that each group’s iFU threshold value differed from that of the others in a statistically significant fashion, with p < 0.0001.
