
Figure 2.
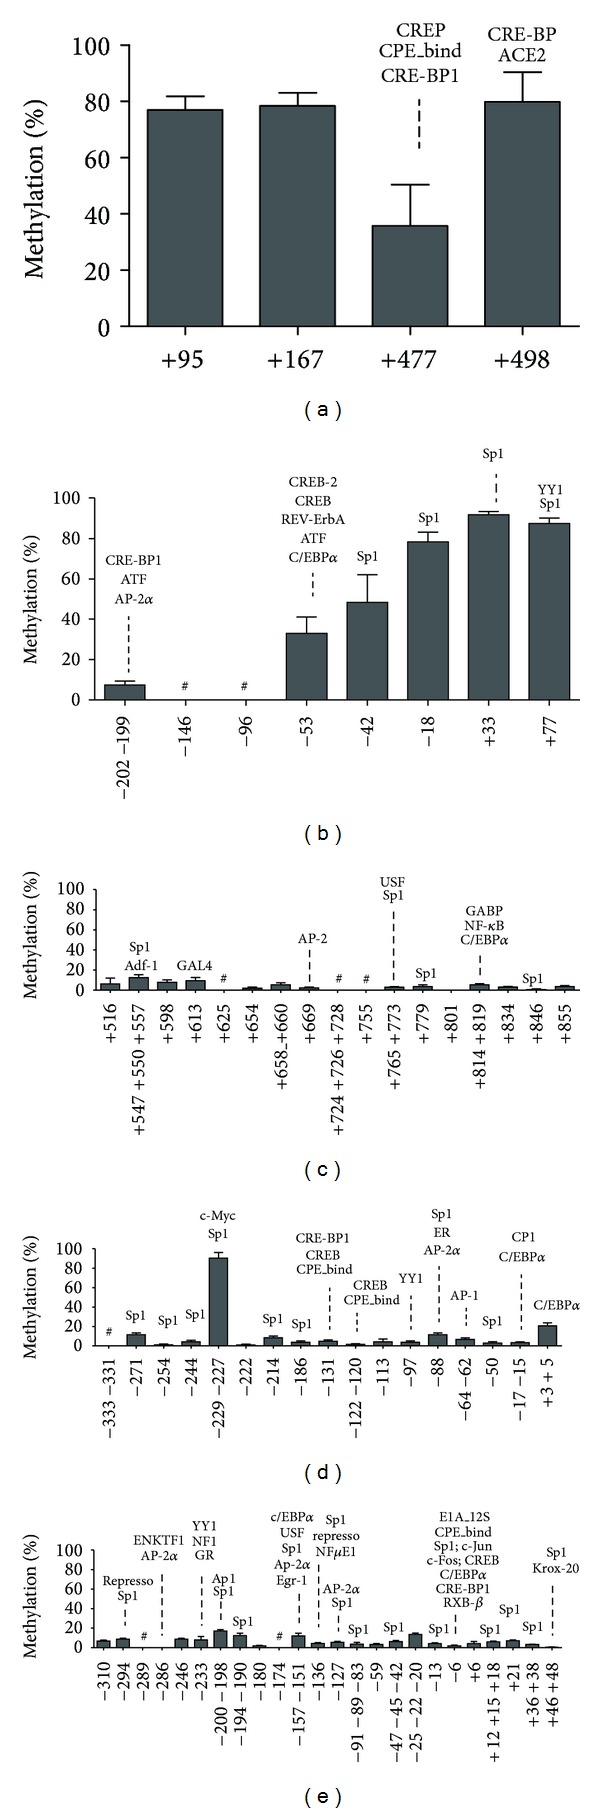
Baseline DNA methylation profile of the genes (a) CD36, (b) FFAR3, (c) CD14, (d) PDK4, and (e) FADS1 as determined in PBMC from overweight young women before weight loss treatment. The bars represent methylation levels of each CpG and are numbered according to the transcription start site. The predicted binding sites for transcription factors that are associated with the CpGs (identified by AliBaba software with a homology of 75%) are also indicated. Data are mean ± SD, n = 12. #Not analyzed.