
Figure 3.
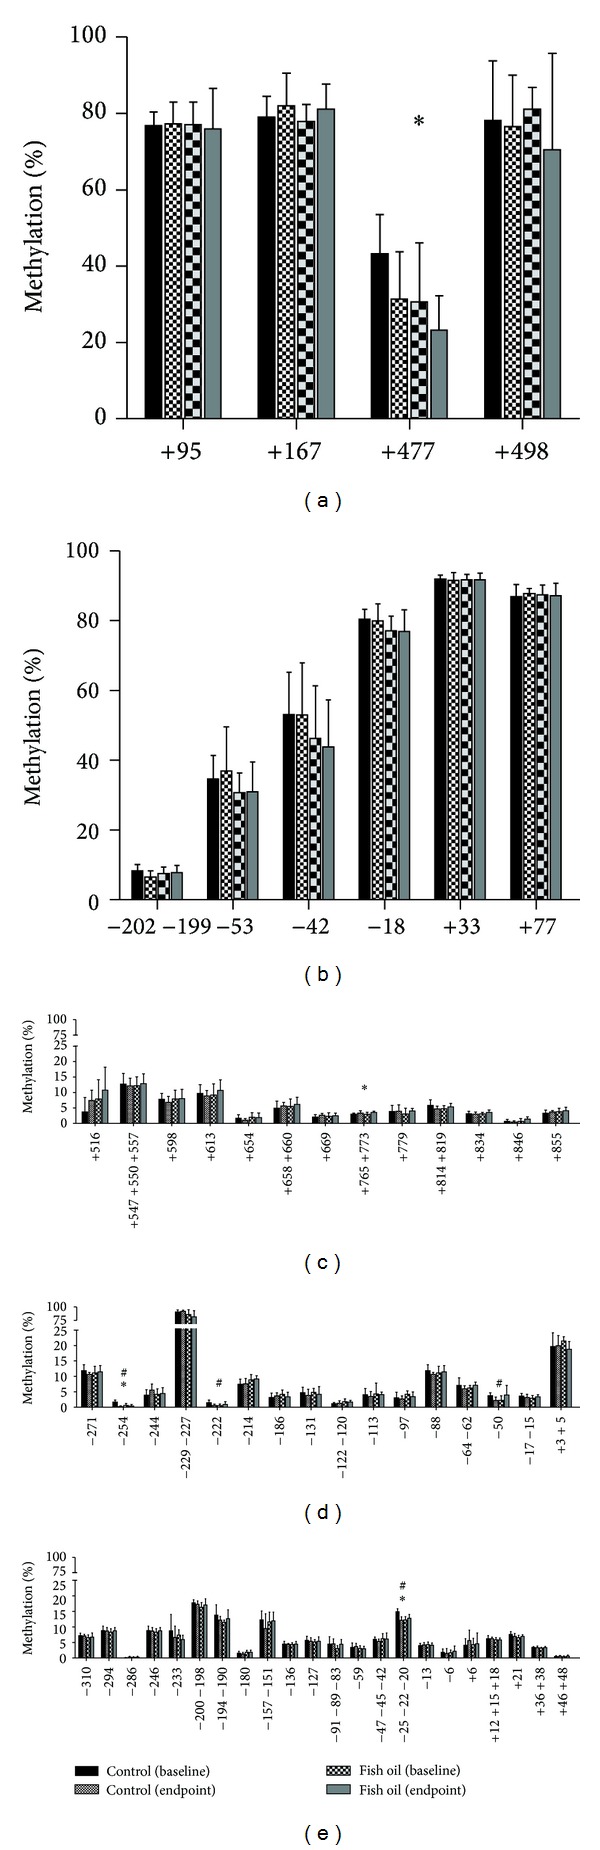
Methylation of the CpGs located in the studied regions of the genes (a) CD36, (b) FFAR3, (c) CD14, (d) PDK4, and (e) FADS1 in PBMC from control and fish oil-supplemented women during the 8-week weight loss treatment. Data represent mean ± SD (control n = 5; fish oil n = 7). DNA methylation was determined at baseline and endpoint samples by MassARRAY EpiTyper in triplicate. A general linear model with repeated measures was used to assess the impact of oral supplementation on DNA methylation (between subjects) across the weight loss treatment (within subjects). *P < 0.05, differences due to weight loss (baseline versus endpoint); # P < 0.05, interaction between weight loss effect and oral supplementation.