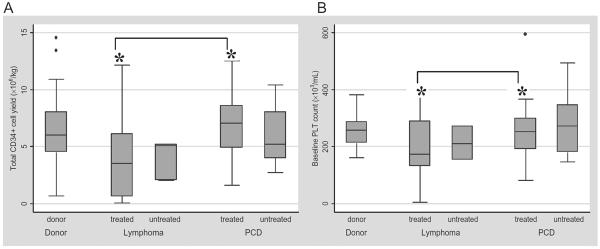
Fig. 3.

(A) Distribution of total CD34+ cell yield by disease and prior treatment status. *Significant difference between the treated PCD and treated lymphoma groups (p < 0.001). (B) Distribution of baseline PLT count by disease and prior treatment status. *Significant difference between the treated PCD and treated lymphoma groups (p = 0.05).
