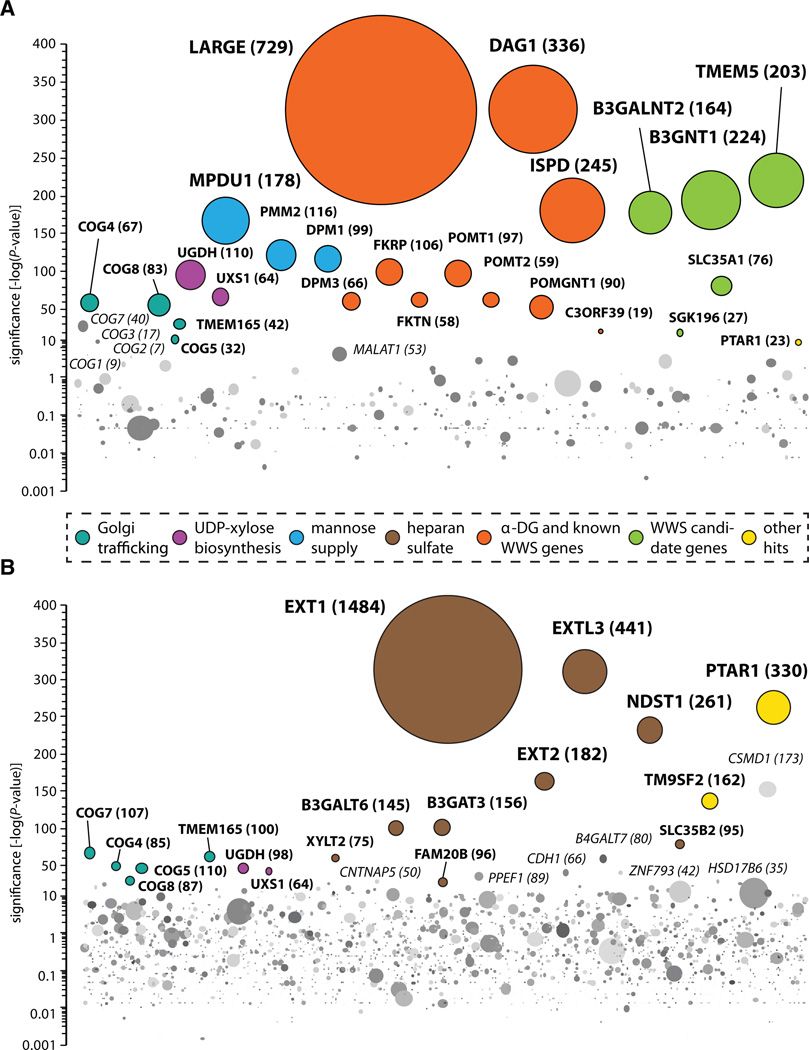
Fig. 2. Cell surface profiling of mutagenized haploid HAP1 cells.
(A) Genes enriched for mutations in a cell population depleted for glycosylated α-DG at the cell surface. The cell population enriched for mutants lacking glycosylated α-DG at the cell surface was analyzed and depicted as described in Fig. 1. (B) A mutant cell population selected for diminished cell surface heparan sulfate was obtained as described above. Data were analyzed as previously, except that, for intron-rich genes, the cut-off for disruptive mutations compared with control cells was adjusted (one-sided Fisher’s exact test, P ≤ 10−21) (13).

