
Fig. 6.
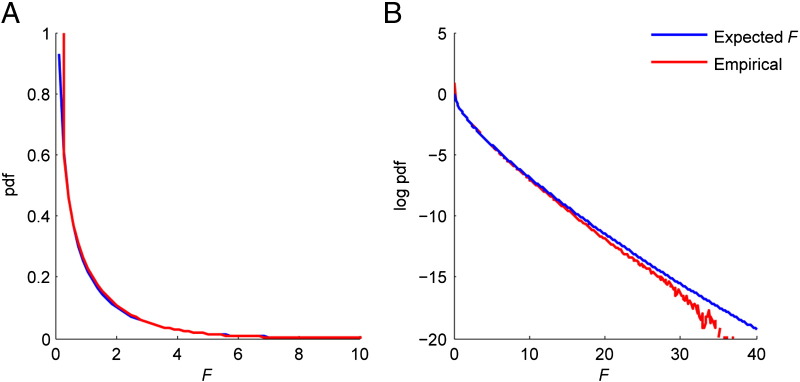
Comparison of the expected F statistic pdf and the empirical F values obtained in 2,048 whole brain SPMs where the null hypothesis should prevail on regular (panel A) and log (panel B) scales. Deviation at larger F values is due to low statistics (e.g. 99.9% of voxels have F < 11.1).