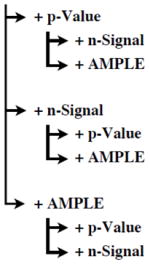
Table 3.
Results of multiple regression prediction model. Baseline R2 was calculated using age of onset and preoperative score. Subsequent models were derived in a step-wise manner, adding LIs derived from each thresholding method, calculating the new R2, and testing if the increase in R2 was significant.
| CLTR | LTS | |||
|---|---|---|---|---|
| R2 | p | R2 | p | |
|
| ||||
| Age of Onset & Preoperative Score | 0.542 | 0.000 | 0.345 | 0.000 |

|
0.599 | 0.031 | 0.402 | 0.072 |
| 0.659 | 0.018 | 0.509 | 0.009 | |
| 0.617 | 0.203 | 0.486 | 0.023 | |
| 0.658 | 0.001 | 0.502 | 0.002 | |
| 0.659 | 0.829 | 0.509 | 0.503 | |
| 0.666 | 0.385 | 0.502 | 0.893 | |
| 0.617 | 0.012 | 0.470 | 0.006 | |
| 0.617 | 0.966 | 0.486 | 0.304 | |
| 0.666 | 0.030 | 0.502 | 0.138 | |
