Fig. 4.
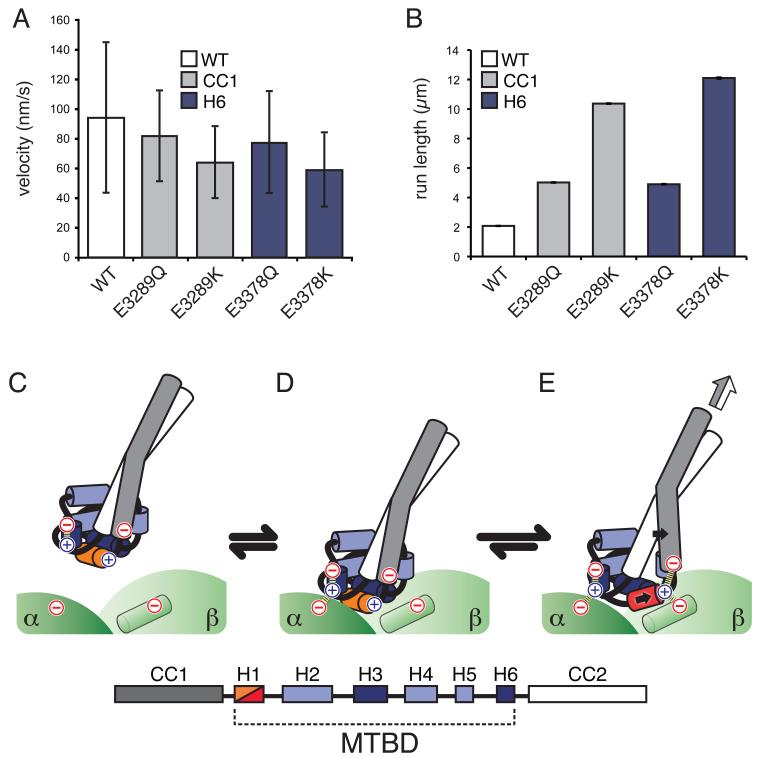
Dynamic salt briges reduce dynein motility. Bar graphs of (A) mean velocities and (B) characteristic run lengths of fluorescently labeled Saccharomyces cerevisiae dynein bearing the equivalent of the indicated Mus musculus mutations moving on MTs. Error bars: standard deviation, SD (A) and standard error of the mean, SE (B). Velocity and run length differences between WT and Q mutants, as well as between Q and K mutations at the same position, are statistically significant (t-test, P < 0.01 for velocity, and two-tailed KS-test, P < 0.01 for run length). The data for the double mutant (E->K at both CC1 and H6) was omitted because run lengths could only be determined under more stringent motility conditions (Fig. S10). (C-E) Molecular model for the coordination of nucleotide state and MT binding by dynein (see text for details). (C) Unbound dynein in the low affinity conformation, H1 is colored orange. (D) Initial interaction with a new binding site. (E) Repositioning of H1 (now in red) leads to the formation of new ionic interactions with β-tubulin (green cylinder) that stabilize the high-affinity state of the MTBD. The repositioning of H1 is accompanied by a movement in CC1; both movements are indicated by solid black arrows. The conformational change in the MTBD biases the registry of the coiled-coil towards the high-affinity α state, a change that can propagate to the motor domain (white/grey arrow). Ionic interactions are indicated with dashed lines, The identities of the helices in the MTBD are indicated by the key.

