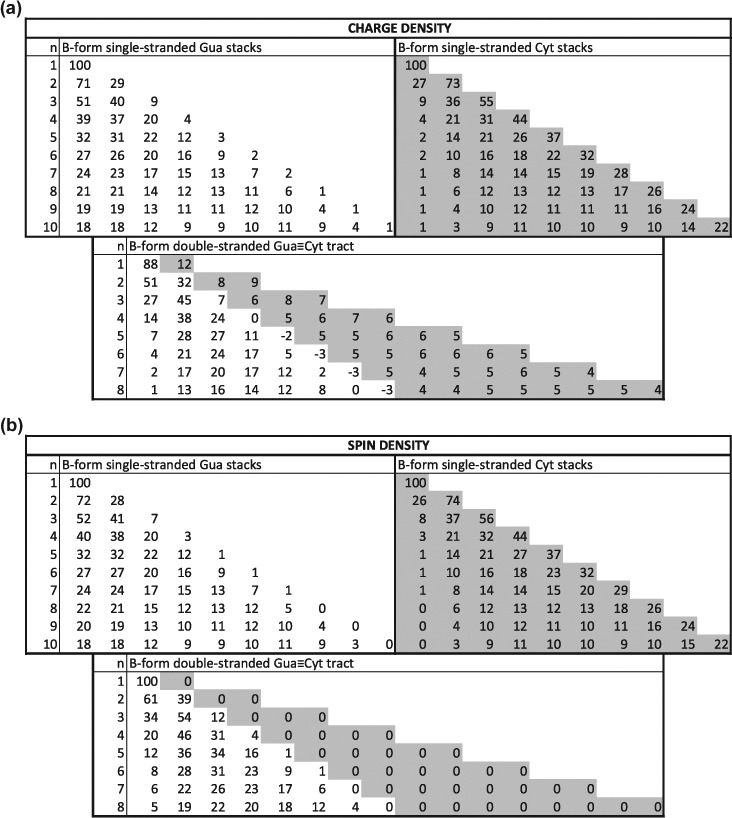
Figure 3.

Mulliken charge and spin density distribution (in %) of B-form single-stranded homo-Gua and Cyt stacks, from one to 10 bases, and of B-form double-stranded Gua ≡ Cyt tracts, from one to 8 base pairs, calculated at M06-2X level of theory with 6-31G* basis set; n indicates the number of successive bases for single strands and of base pairs for double strands; for double strands, the densities are given for the first strand, from 5′ to 3′, on white background, and then for the second strand, from 5′ to 3′, on gray background. (a) Charge density; (b) Spin density.
