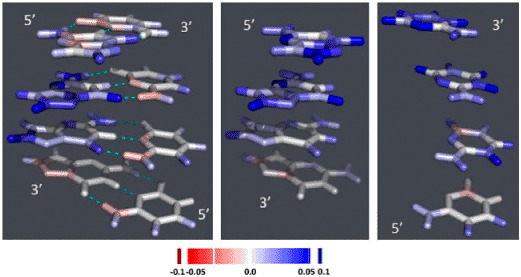
Figure 5.

Difference in charge distribution between the radical-cationic nucleobase stacks and the corresponding neutral stacks: 4-nucleobase stacks in B-conformation. The figures are drawn using PYMOL (DeLano, 2002). Left: double-stranded Gua≡Cyt tract; middle: single-stranded Gua-stack; right: single-stranded Cyt-stack. The color ramp used is depicted at the bottom of the figure.
