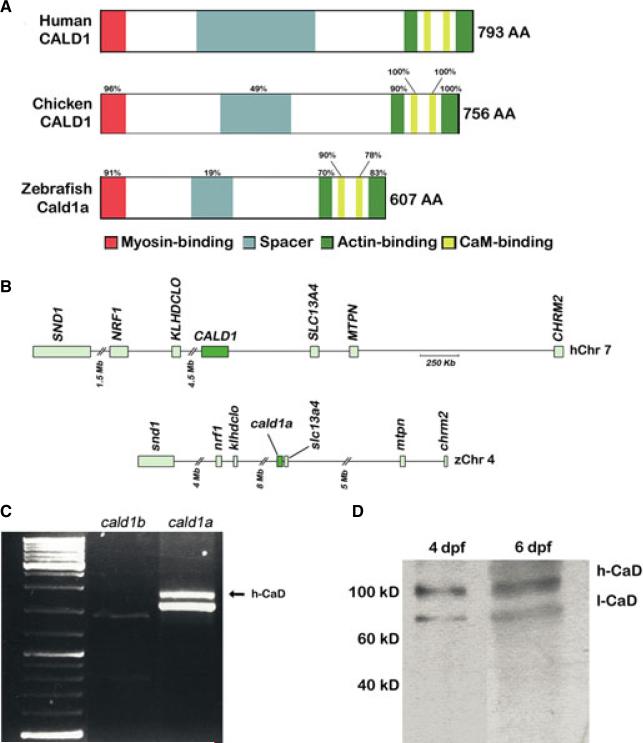
Figure 2.
Zebrafish smooth muscle Caldesmon (h-CaD). (A) Schematic representation of the human, chicken and zebrafish h-CaD orthologs. Conserved protein domains and percent amino acid homology are indicated. (B) Conserved syntenic relationships surrounding the human CALD1 locus on chromosome 7 and the zebrafish cald1a locus on chromosome 4. (C) RT-PCR showing amplification of the full length cDNA corresponding to the high and low molecular weight zebrafish cald1a isoforms from intestinal cDNA. A correctly sized transcript for the predicted low molecular weight cald1b isoform is also detected. (D) Western blot showing intestinal levels of CaD isoforms. Molecular weight standards indicated. Mb, megabase; Kb, kilobase; dpf, days post fertilization.

