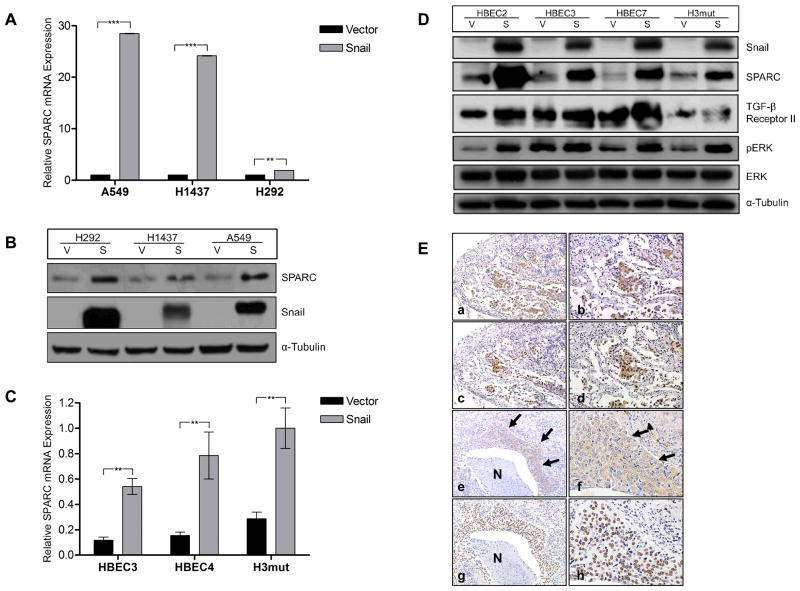
Figure 1. Snail overexpression is correlated with upregulation of SPARC.
(A) The NSCLC cell lines A549, H1437, and H292 were stably transfected with either a Vector control plasmid (V) or a Snail expression plasmid (S). Total RNA was isolated from the cell lines and expression levels of SPARC were evaluated by q-RT-PCR using TaqMan primers. mRNA levels were normalized to GUSB. (B) The same NSCLC cell lines were evaluated for protein level expression of Snail and SPARC by western blotting. Protein levels were normalized to α-Tubulin. (C) Total RNA was isolated from HBEC3-V/S, HBEC4-V/S, and H3mut-V/S cell lines. Expression levels of SPARC were evaluated by q-RT-PCR using TaqMan primers. mRNA levels were normalized to GUSB. A similar pattern was also observed for HBEC7 (data not shown). (D) The same HBEC cells were evaluated for protein level expression of Snail and SPARC by western blotting. Protein levels were normalized to α-Tubulin. (E) Serial sections of ADC (a–d). Positive (brown staining) cytoplasmic expression of SPARC (row 1; a and b) and positive nuclear expression of Snail (row 2; c and d) were observed in the epithelial component of the neoplasm; × 100 low magnification (left; a and c) and × 200 high magnification (right; b and d) images of the same specimen and staining condition. Serial sections of SCC (e–h). Positive cytoplasmic expression of SPARC (row 3; e and f, arrows) and positive nuclear expression of Snail (row 4; g and h) were observed in the epithelial component of the neoplasm; × 100 low magnification (left; e and g) and × 400 high magnification (right; f and h) images of the same specimen and staining condition. Necrotic areas of the neoplasm (N) do not stain for either protein. (** = p < 0.001; *** = p < 0.0001)

