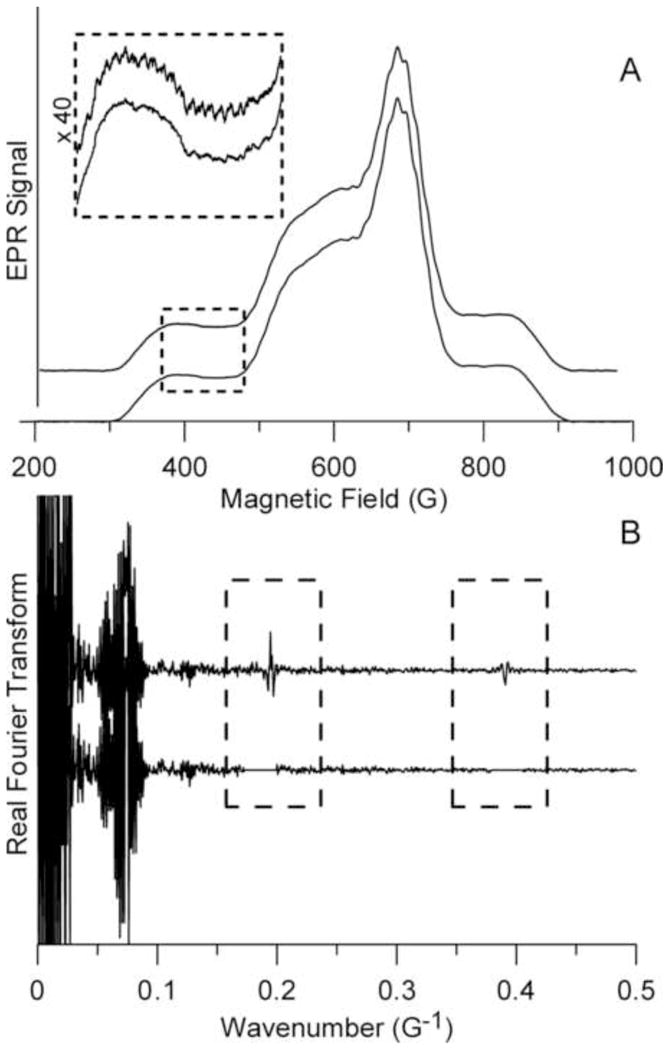
Figure 2.

NARS-EPR spectra of CuIm. Trace A (upper) is the raw NARS spectrum, and Trace B (upper) is the Fourier transform. Trace B (lower) is the Fourier-filtered NARS spectrum, generated by editing the FT as indicated. The dashed box of A shows a low-field region of the raw (upper trace) and Fourier-filtered (lower trace) spectra expanded for clarity. The MDIFF algorithm was applied to Trace A, lower, to produce Figures 3, 4, 5A, 6, and 7.
