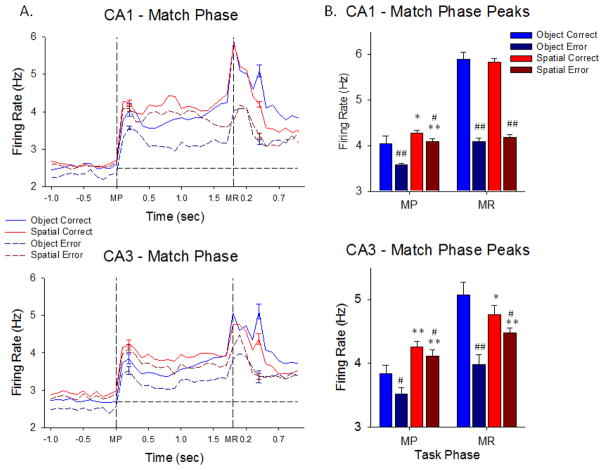
Figure 3.
Hippocampal neuron firing in the Match Phase of the DMS task. A. TBH plots as in Figure 2A show trial-based histograms of average firing of CA1 and CA3 neurons during the Match phase of the DMS task. The two task events indicated by the vertical dotted lines were 1) Match screen presentation (MP) occurring at the end of the prior variable delay period, and then 2) the subsequent Match phase response (MR) for correct vs. incorrect selection of the Sample feature executed in the presence of other 1–6 other images. Each peak was significantly increased over baseline by standard scores (Z>3.09, p<0.001, see Methods). The peaks with error bars after the MR occurred on correct trials when the juice reward valve sounded. Plots reflect sustained elevated mean firing rates throughout the entire Match Phase for both CA1 and CA3 hippocampal cells in each of the 4 indicated conditions with respect to screen presentation of images and performance of that type of trial. B. Average peak firing rates of CA1 and CA3 hippocampal cells in the Match phase shown for each of the events (MP, MR) in each trial type (Object and Spatial) sorted with respect to performance (correct and error) on the same trials. *p<0.01, **p<0.001 Object vs. Spatial trial peaks, #p<0.01, ##p<0.001 Correct vs. Error trial peaks.

