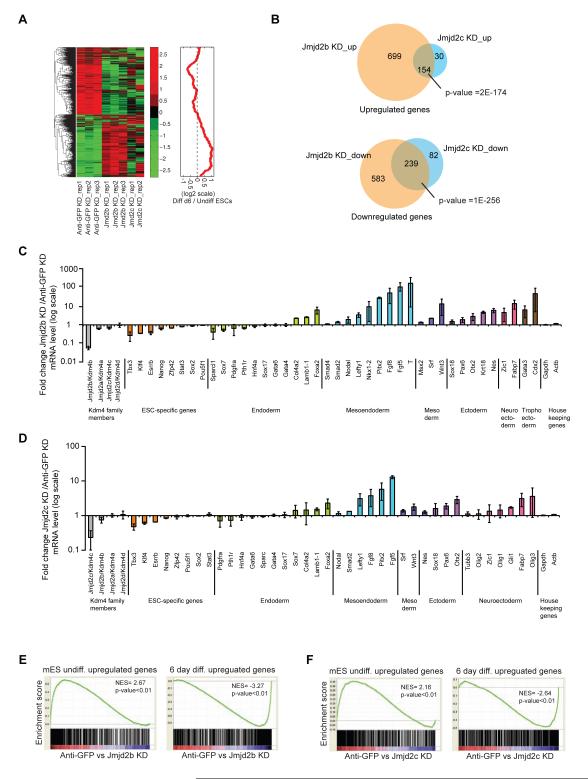
Figure 2. Jmjd2b/Kdm4b and Jmjd2c/Kdm4c are essential for mESCs identity.
(A) Hierarchical clustering of gene expression profiles from Anti-GFP (control), Jmjd2b (Jmjd2b-1, 4 shRNAs) and Jmjd2c (Jmjd2c-1, 2 shRNAs) depleted cells. Average fold change from two different shRNAs was calculated. Heat map represents Z-score of expression values, while the red curve shows the relative expression changes of these cluster genes between undifferentiated and differentiated ES cells smoothed by a moving window of size 50.
(B) Venn diagrams represent overlapping up or down-regulated genes between Jmjd2b and Jmjd2c depleted cells.
(C & D) Gene expression analyses for ESC-specific genes and lineage-specific differentiation genes from Jmjd2b and Jmjd2c depleted cells. Gapdh and Actin used as internal control. Data shown are averaged from three biological replicates. Data are represented as mean +/− SEM; n=3; p-values were calculated using ANOVA; p-value <0.01.
(E & F) GSEA of differentially expressed gene set of Jmjd2b and Jmjd2c depleted cells. NES= normalized enrichment score, p= nominal p value. See also Figure S2.

