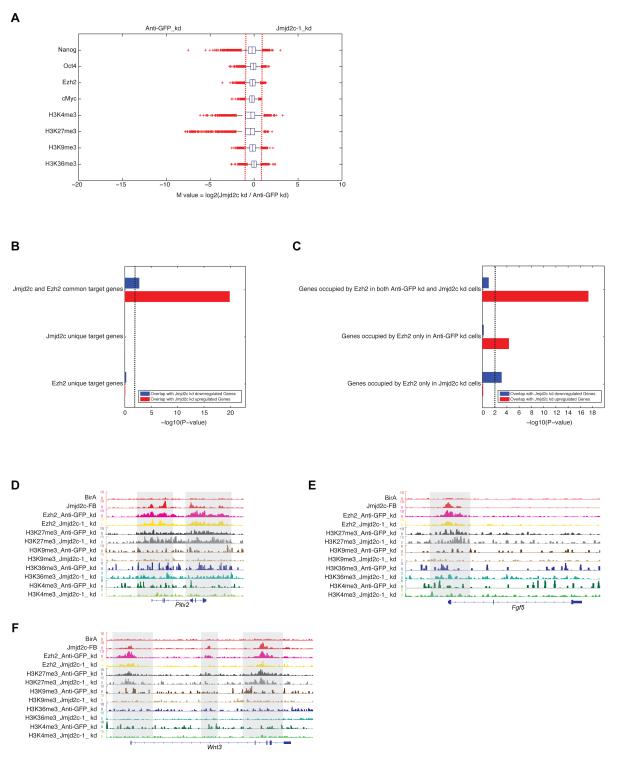
Figure 5. Jmjd2c/Kdm4c assists PRC2 in repression in mESCs.
(A) Box plots of the log2 fold change of binding intensities between Anti-GFP (control) and Jmjd2c depleted cells for Nanog, Oct4, Ezh2, cMyc, H3K4me3, H3K27me3, H3K36me3 and H3K9me3. Red crosses correspond to outliers.
(B) P-values represent enrichment of overlap between upregulated or downregulated genes from Jmjd2c knockdown cells compared to Anti-GFP (control) knockdown cells and target genes occupied by either Jmjd2c or Ezh2 or both in mESCs at “promoters”. Height of bars represents -log10 transformed P-value derived from right-tailed Fisher’s exact test, and dotted line corresponds to P-value of 0.01.
(C) P-values represent enrichment of overlap between upregulated or downregulated genes from Jmjd2c knockdown cells compared to Anti-GFP (control) knockdown cells and the promoter target genes of Ezh2 in these two cell types. P-value represents same as (B).
(D-F) Genomic tracks of ChIP-seq intensities of Jmjd2c, Ezh2 and histones marks in both Anti-GFP (control) and Jmjd2c KD cells at selected upregulated gene loci upon Jmjd2c depletion (Pitx2, Fgf5 and Wnt3). See also Figure S5.

