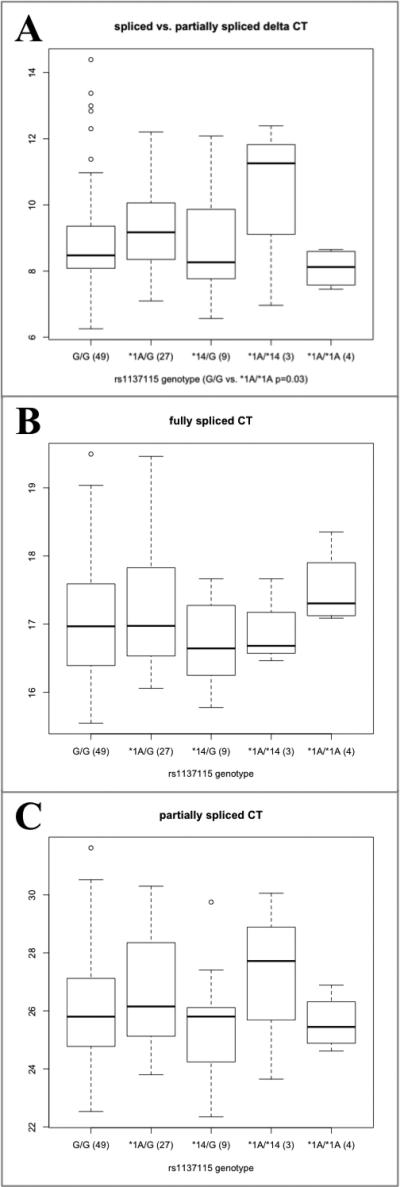
Fig. 5.

(a) Relative expression of fully spliced and partially spliced CYP2A6 in liver cDNAs. Data points are the difference in Ct between PCR reactions for the partially spliced minus the spliced form (larger Ct corresponds to lower expression). (b) Ct for total expression of fully spliced CYP2A6, (c) Ct for total expression of partially spliced CYP2A6. Primers intron 1-forward and boundary 2/3-reverse are used to detect the partially spliced form; boundary 1/2-forward and boundary 2/3-reverse are used to detect the fully spliced form. The boxplot summarizes the data distribution of (n) samples. The box represents the interquartile range, divided by a line indicating the median; whisker lines extend to the maximum and minimum values within × 1.5 the interquartile range and further outliers are marked with circles.
