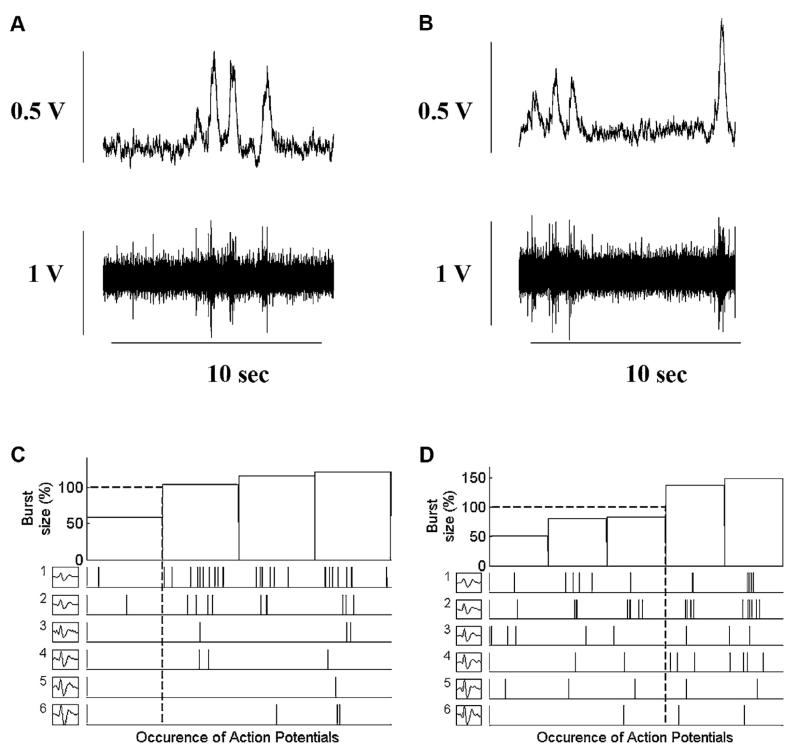
Fig. 2.
Occurrence of postganglionic sympathetic APs for each AP cluster as a function of burst size between baseline (plots A and C) and during the CPAP (plots B and D) in one healthy control subject. Plots A and B provide the integrated and filtered raw muscle sympathetic nerve activity (MSNA) tracings during baseline and CPAP breathing used to display the range of integrated sympathetic bursts ordered by burst size as a percentage of baseline (C and D, top panels) together with the occurrence of postganglionic sympathetic action potentials as a function of integrated burst size for each action potential cluster (C and D, lower panels). Dashed lines represent the mean of integrated burst sizes (horizontal) and corresponding action potential cluster range (drop lines). Note the same number of different clusters present at baseline and during the CPAP breathing (6).

