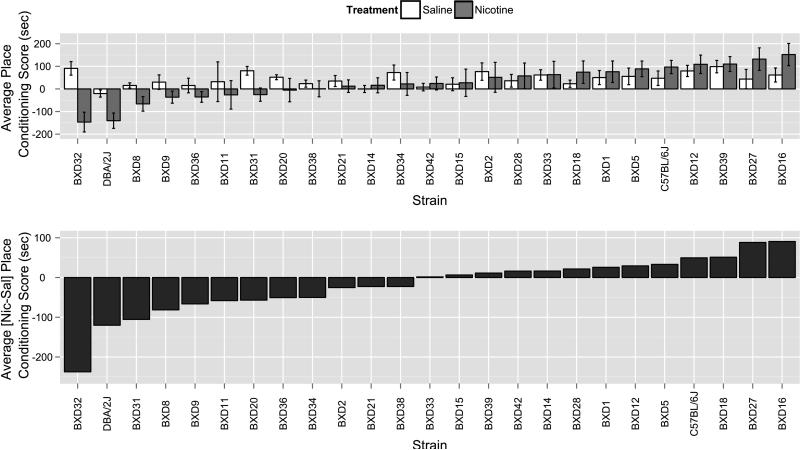
Figure 1. BXD strain distribution for place conditioning for 0.5mg/kg nicotine.
a) Following conditioning with either saline-saline (0.9%) or saline-nicotine (0.5mg/kg), nicotine place conditioning scores (black) on test day for BXD strains follow a continuous distribution, indicative of a quantitative trait. Progenitor strains, C57BL/6J and DBA/2J, show divergent phenotypes for this trait. Each point represents the mean ± SEM of n=6-12 mice per group. b) Transformed distribution, nicotine minus saline BXD strain means.

