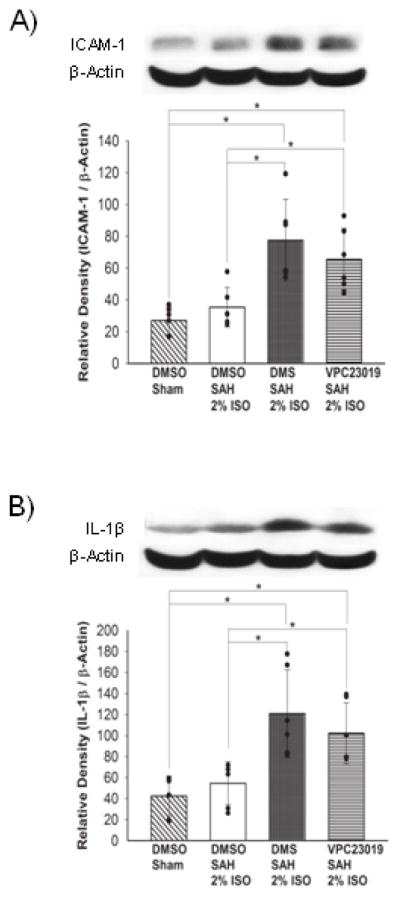
Figure 5.

Representative Western blots and quantitative analysis of ICAM-1 (A) and IL-1β (B) expressions in the left cerebral hemisphere at 24 hours after SAH. The protein band density values are calculated as a ratio of that of β-actin. 2% ISO, 2% isoflurane group; n=6 per group; values, mean±SD; *P<0.05, ANOVA.
