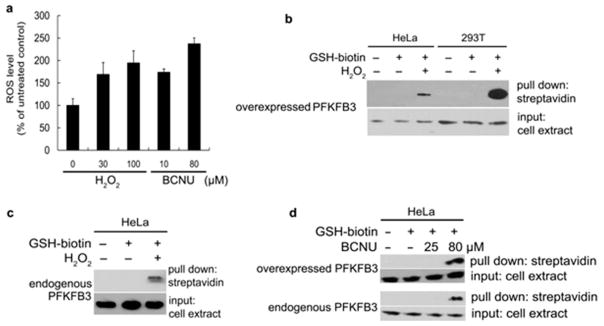
Figure 3. PFKFB3 S-glutathionylation induced by oxidative stress inside cancer cells.

(a) ROS levels in HeLa cells after treatment with the varying amounts of H2O2 and BCNU. Error bars denote SEM. (b) Detection of ROS-induced S-glutathionylation of cellular PFKFB3. PFKFB3-overexpressing HeLa cells and 293T cells were treated with or without 1.5mM Bio-GEE and 100 μM H2O2. Then, biotin-GSS-protein conjugates were precipitated using streptavidin-agarose. Immunoblotting shows PFKFB3 levels before (input, bottom) and after precipitation (upper) (60 μg of total protein per lane). (c) Detection of ROS-induced S-glutathionylation of endogenous PFKFB3 in HeLa cells. With HeLa cells transfected with the empty vector, an experiment similar to (b) was performed. (d) Detection of ROS-induced S-glutathionylation of overexpressed (upper) and endogenous (lower) PFKFB3. HeLa cells were treated with the indicated doses of BCNU to induce S-glutathionylation and the experimental methods were the same as (b) and (c). Immunoblotting shows PFKFB3 levels before (input, bottom) and after precipitation (upper).
