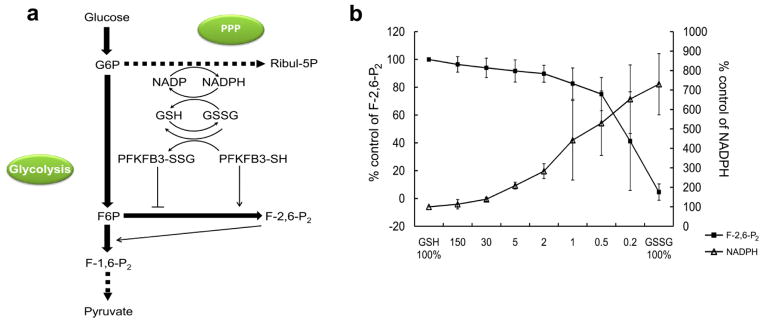
Figure 4. A model for the carbohydrate flux upon PFKFB3 S-glutathionylation.

(a) This diagram is provided to shows a hypothetical role played by S-glutathionylation of PFKFB3 in a relationship between fructose-2,6-bisphosphate (Fru-2,6-BP), PFKFB3, and the PPP. It has been hypothesized that increased S-glutathionylation of PFKFB3 leads to decreases in the Fru-2,6-BP level and in the carbohydrate flux to glycolysis and, in turn, an increase in the flux to the PPP and the level of GSH. Solid/bold lines represent direct, one-step biochemical reactions, and indirect, multi-step reactions are represented by dotted lines. Inhibition and activation of enzymatic steps are indicated by solid/plain lines. G-6-P, glucose-6-phosphate; Ribul-5-P, ribulose-5-phosphate; Fru-6-P, fructose -6-phosphate; Fru-1,6-BP, fructose-1,6-bisphosphate; Fru-2,6-BP, fructose-2,6-bisphosphate; PFKFB3-SSG, S-glutathionylated PFKFB3; PFKFB3-SH, unglutathionylated PFKFB3. (b) Enzymatic assay for rerouting of carbohydrate metabolic flux in response to PFKFB3 S-glutathionylation. Changes in the formation of Fru-2,6-BP and NADPH from varied extents of S-glutathionylation of PFKFB3 was measured. The extent of S-glutathionylation was controlled with varied molar ratio of GSH to GSSG in a total concentration kept as 3 mM.
