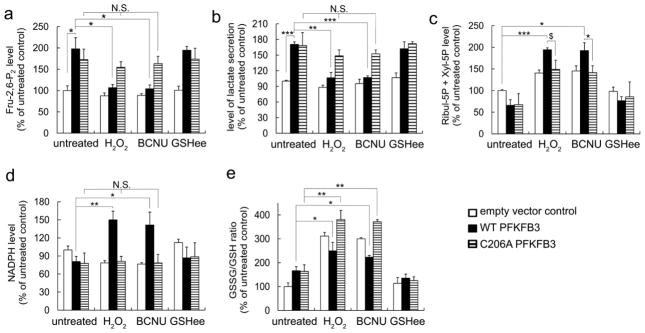
Figure 5. PFKFB3 S-glutathionylation increases the carbohydrate flux to the PPP.

(a) Intracellular Fru-2,6-P2 concentration, (b) the secreted lactate levels (c), cellular concentration of Ribul-5P and Xyl-5P, (d) NADPH, and (e) GSH/GSSG ratio in HeLa cells transiently expressing empty vector pcDNA3.1 (Con), expression plasmids for WT- or C206A-PFKFB3 after treatment with 100 μM H2O2, 50 μM BCNU, or 1.5 mM GSHee to induce PFKFB3 S-glutathionylation. Absolute values were normalized to the total protein concentration and changes in metabolite levels are expressed as a percent of control (without oxidant treatment). T-test (*P < 0.05, **P < 0.01, ***P< 0.001, $P<0.06 (marginally significant); N.S., not significant) used for all the rest figures.
