
Fig. 2.
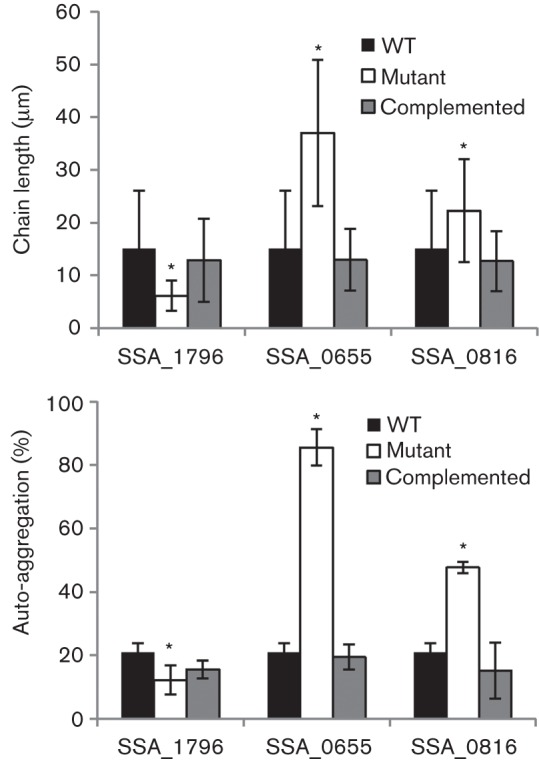
Cellular chain length and auto-aggregation of selected mutants and their complementation. Upper panel, the cellular chain lengths of mutants and their complemented strains were examined and compared with the wild-type (WT) as described in Methods. Lower panel, their auto-aggregations were determined by OD600 and the aggregation percentage was calculated as described in Methods. * P<0.05. Error bars indicate ±sd.