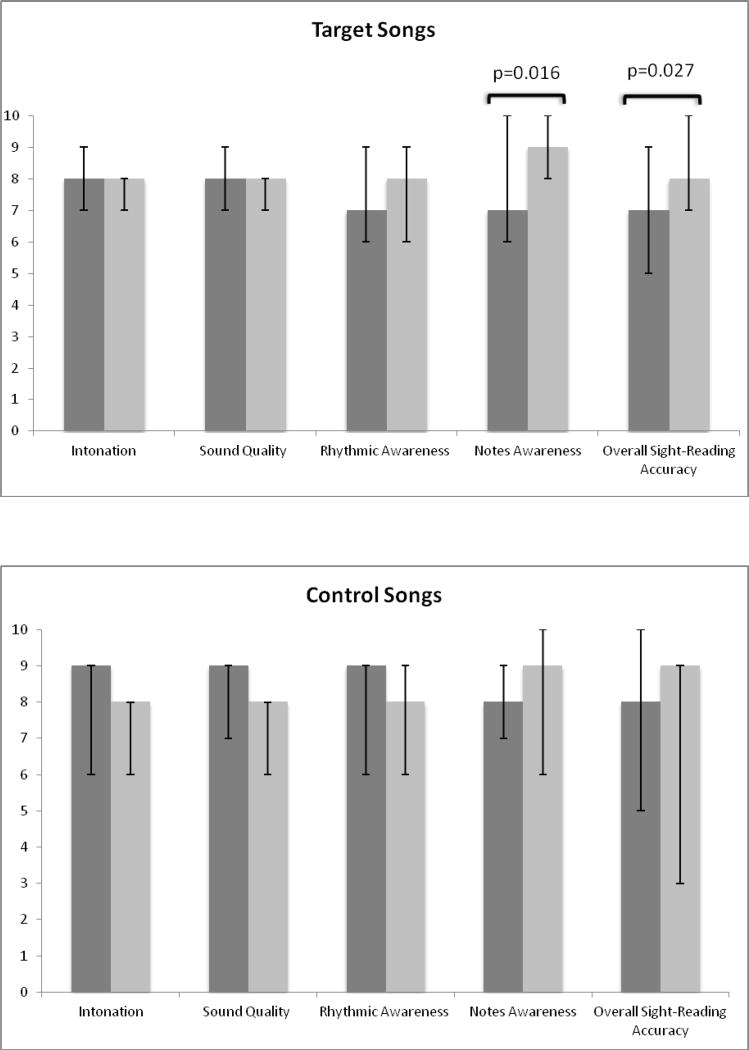
Figure 2. SZ’s performance on the Target and Control songs at Time 1 and Time 2.
The results are presented as median scores. The error bars represent the range between minimum and maximum scores. Time 1 corresponds to dark grey bars and Time 2 to the light grey bars. No significant differences were found between target and control songs at Time 1 on any of the measures. SZ’s performance improved significantly on the target songs from Time 1 to Time 2, as measured by Notes Awareness and Overall Sight-Reading Accuracy indices. His performance on the control songs did not change significantly from Time 1 to Time 2.

