FIGURE 2.
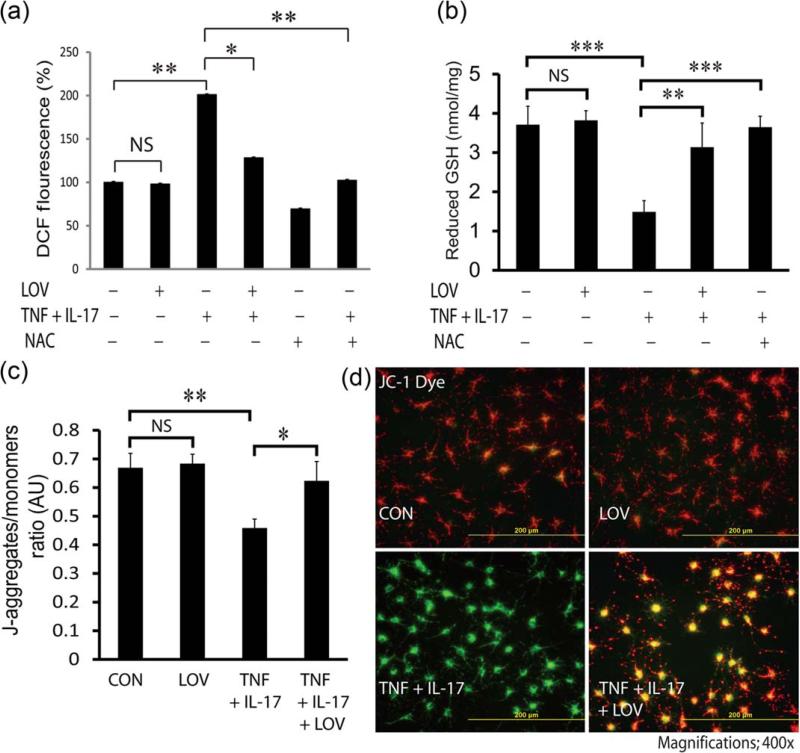
LOV attenuates ROS generation and protects mitochondrial health in OLs exposed to cytokines. OLs were exposed to cytokines in the presence or absence of LOV (2.0 μM)/or N-acetyl cysteine (NAC; 5 mM) as detailed in the Fig. 1 legend. (A) The composite mean ± SE of three to four samples analyzed in triplicate depicts ROS levels in treated OLs for 48 h. Data are presented as changes % of controls. (B) The composite mean ± SE of three to four samples analyzed in triplicate depicts GSH (reduced) level in treated OLs for 48 h. (C) The composite mean ± SE of three to four samples analyzed in triplicate in treated OLs for 48 h depicting the ratio of J-aggregates/monomers (arbitrary units; AU). (D) The representative fields of slides depict a shift of fluorescence from orange red (mitochondrial membrane polarized) to green (mitochondrial membrane depolarized) in treated OLs for 48 h. Statistical significance as indicated in Fig. 1 legend. [Color figure can be viewed in the online issue, which is available at wileyonlinelibrary.com.]

