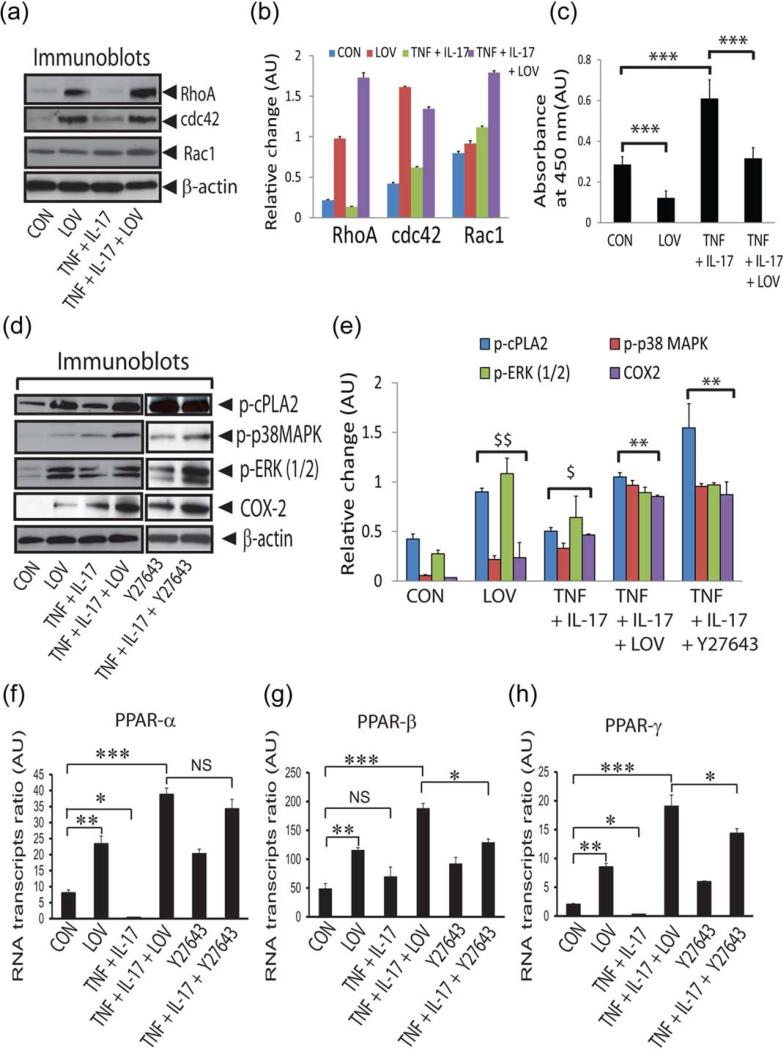
FIGURE 4.
LOV-mediated inhibition of Rho-ROCK activity enhances PPARs transactivation in OLs. OLs were exposed to cytokines and LOV as detailed in the Fig. 1 legend. Representative immunoblots (A) and the composite mean ± SE (B) of three samples depict levels of Rho family GTPases normalized to β-actin in the cytoplasm of treated OLs for 24 h. (C) The composite mean ± SE of similarly treated three samples depicts ROCK activity in the lysate (200 μg of protein) of OLs. Representative immunoblots (D) and the composite mean ± SE (E) of three to four samples depict protein levels in treated OLs for 24 h. (F–H) The composite mean ± SE of three to four samples depicts PPAR subtype mRNA transcripts normalized to β-actin in treated OLs for 24 h. Statistical significance as indicated in Fig. 1 legend. For E, $P < 0.05 and $$P < 0.01 versus CON and **P < 0.01 versus TNF + IL-17. [Color figure can be viewed in the online issue, which is available at wileyonlinelibrary.com.]

