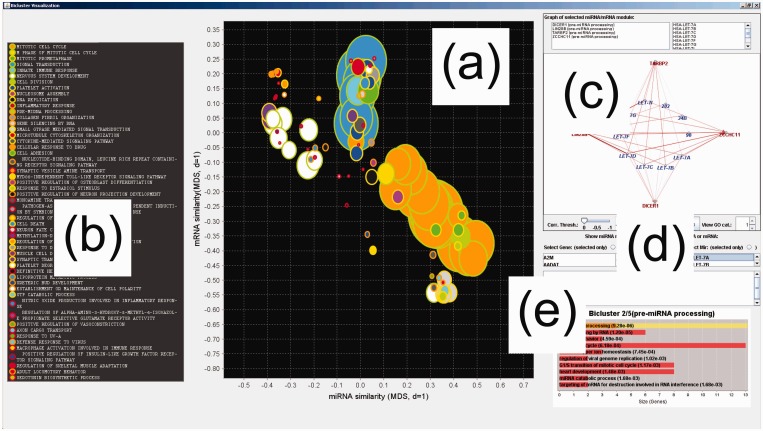
Figure 4.
(a) Interface of the custom software application built to support visualization and (b) functional annotation of all miRNA modules (biclusters) uncovered in a data set. (c) Detailed viewing of the members and interactions within individual miRNA functional modules, (d) querying of an individual miRNA or mRNA of interest and (e) detailed GO enrichment analysis based on the mRNAs within the module is also supported.

