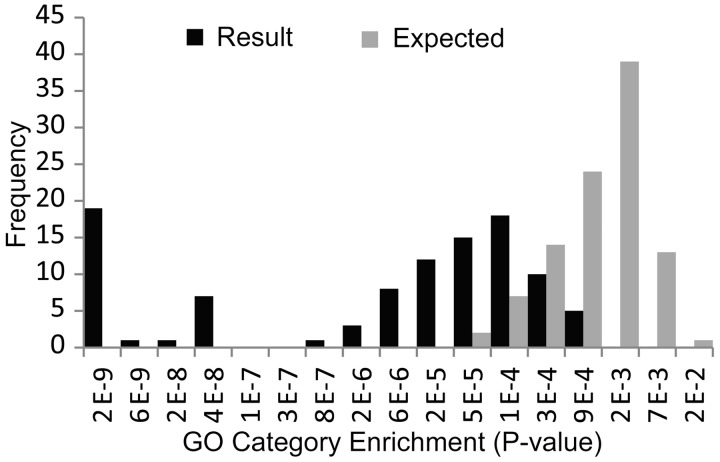
Figure 7.
The spread of significance values (based on Gene Ontology functional enrichment) of the 100 miRNA modules retrieved from the neuroblastoma data set (black bars) compared with the expected distribution (grey bars), i.e. 100 biclusters generated after mRNA labels were randomly permuted. miRNA family/cluster enrichment for these sets is examined in Table 2.

