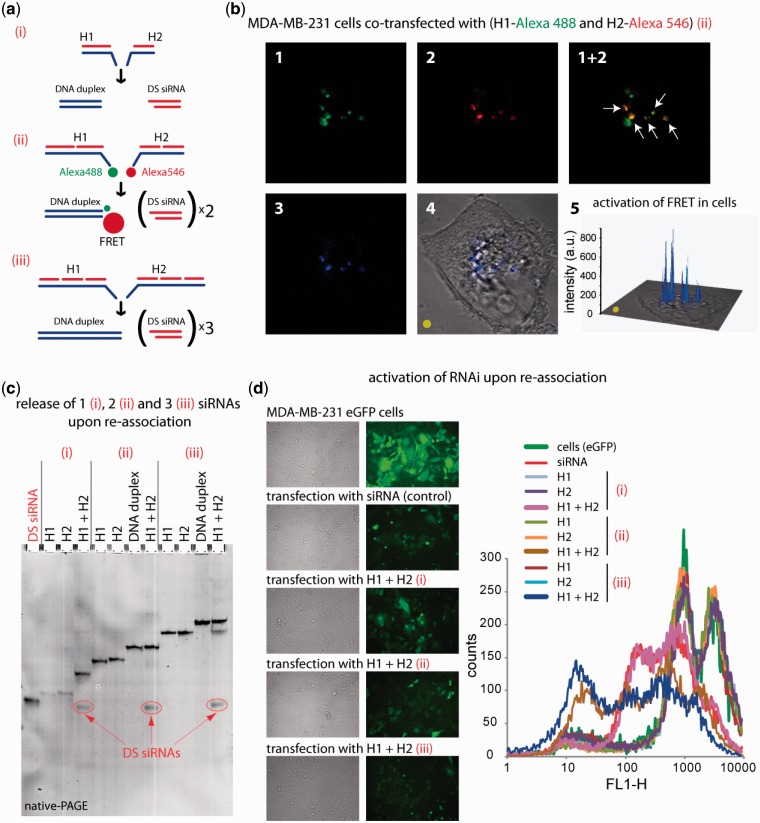
Figure 3.
RNA–DNA hybrid re-association with DS siRNA release and intracellular FRET tracking. (a) Schematic of different size hybrids re-association compared in these experiments [(i) H1(sDS) and H2(aDS); (ii) H1(sDS_sDS) and H2 (aDS_aDS); (iii) H1(sDS_sDS_sDS) and H2(aDS_aDS_aDS)]. (b) FRET experiments: cells were co-transfected with cognate hybrids labeled with Alexa 488 and Alexa 546, and images were taken on the next day. (c) Total SYBR Gold staining native PAGE demonstrating the release of DS siRNAs. Due to the full complementarities of the resulting DNA duplexes, there are no higher order bands observed on the gel. (d) GFP knockdown assays. Three days after the transfection of cells with auto-recognizing RNA–DNA hybrids programmed to release one [hybrids (i)], two [hybrids (ii)], and three [hybrids (iii)] DS siRNAs against eGFP, eGFP expression was observed by fluorescence microscopy and statistically analyzed with flow cytometry experiments. As the control, siRNA duplexes against eGFP were used. Image numbers in (b) correspond to: Alexa488 emission (1), Alexa546 emission (2), bleed-through corrected FRET image (3), differential interference contrast image with corrected FRET overlap (4), 3D chart representation of bleed-through corrected FRET image with the yellow dot indicating the correspondence (5).

