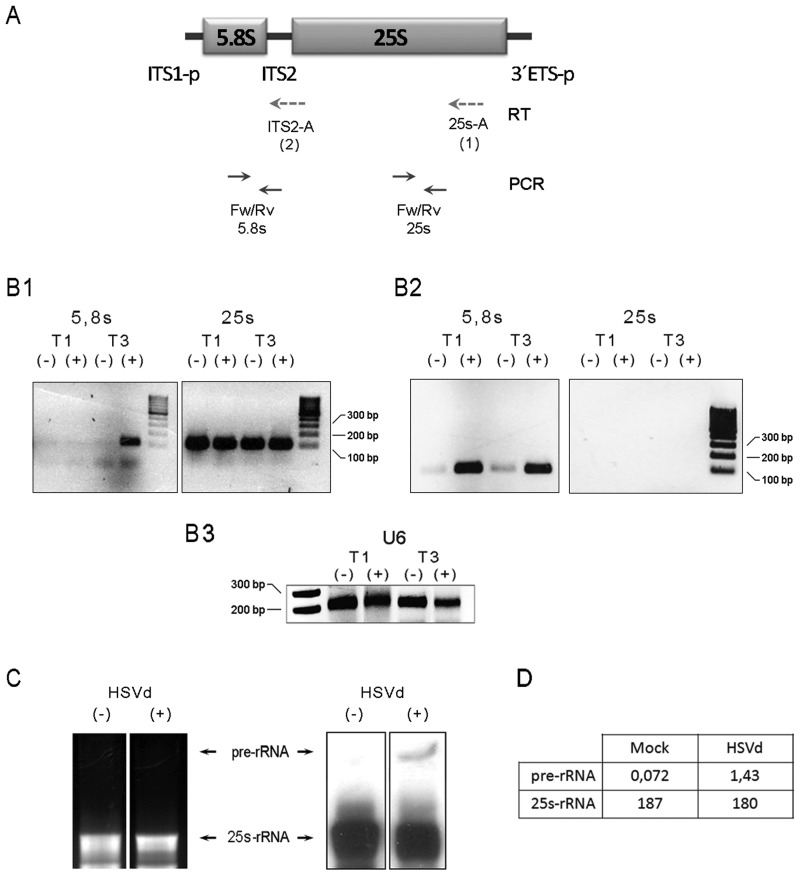
Figure 3.
Precursor for rRNAs (pre-rRNAs) accumulates in infected plants. (A) Diagram (no scale) of the pre-27S rRNA (ITS1-p and 3′ETS-p refer to partially processed transcribed spacers). The dotted arrows below depict the oligos used for the RT reaction starting from the 25S 3′-end (25s-A/RT-1) and the ITS2 (ITS2-A/RT-2) regions of the pre-rRNA. Solid arrows indicate the oligos used in the PCR amplification. (B) The RT-PCR analyses of the pre-rRNA expression in the HSVd-infected (+) and mock-inoculated (−) plants at 10 (T1) and 30 (T3) days post-inoculation. The initial cDNAs were transcribed using the 25s-A (B1) and ITS2-A (B2) oligos, respectively. (B3) RT-PCR amplification of U6 Small nucleolar RNA (snoRNA) served as control for RNA load. (C) The accumulation of the pre-rRNA (marked with arrows) in the infected plants was validated by northern blot assays in the total RNAs extracted from plants at T3 using a probe complementary to the 3′-end of the 25S rRNA. (D) The band intensity was measured using the Image-J application http://www.imagej.en.softonic.com.

