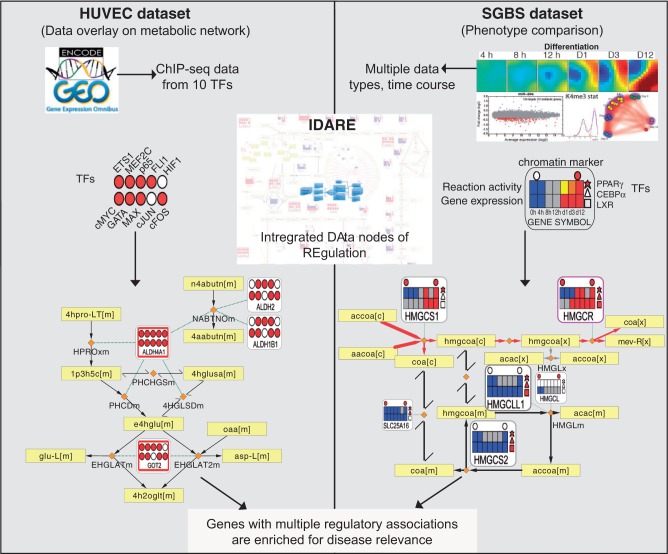
Figure 1.
Conceptual overview of the analysis performed that links the regulatory and metabolic networks for exposing disease-relevant genes. A summary of the data sets and data integration approach is shown. By integrating regulatory network components with metabolic pathways, gene metanodes shown from the IDARE webportal provide a simple and intuitive means to analyze relationships between the metabolic and regulatory networks. HUVEC data set: Overlaying TF-binding data indicated in filled color circles with the metabolic network reaction backbone can be used to examine the co-occurrence of transcriptional regulators that is informative of likely disease association. Yellow rectangular nodes represent metabolites and small orange diamonds represent reactions in the metabolic network. SGBS data set: Often the biological question involves comparison of phenotypic states. Constraint-based modeling methods, established in context of metabolic reconstructions, can be used as exemplified with data from adipocyte differentiation. Those pathways that are predicted to shift to an active state in adipocytes compared with preadipocytes are indicated by the red edge color, yellow and black color correspond to active or inactive reactions in both states. The heatmaps show for each differentiation time point the gene expression (below) and predicted reaction activity (above) where blue indicates low/absent gene expression or inactive reaction, gray, moderate expression or undetermined reaction and red stands for highly expressed gene and active reaction, respectively. The regulators can be added as different shapes. Here, circles above represent the presence (red) or absence (white) of the H3K4me3 marker for active transcription and the three different polygons to the right represent PPARγ (star), CEBPα (triangle) and LXR (square) peak associations (red, present; white, not present).

