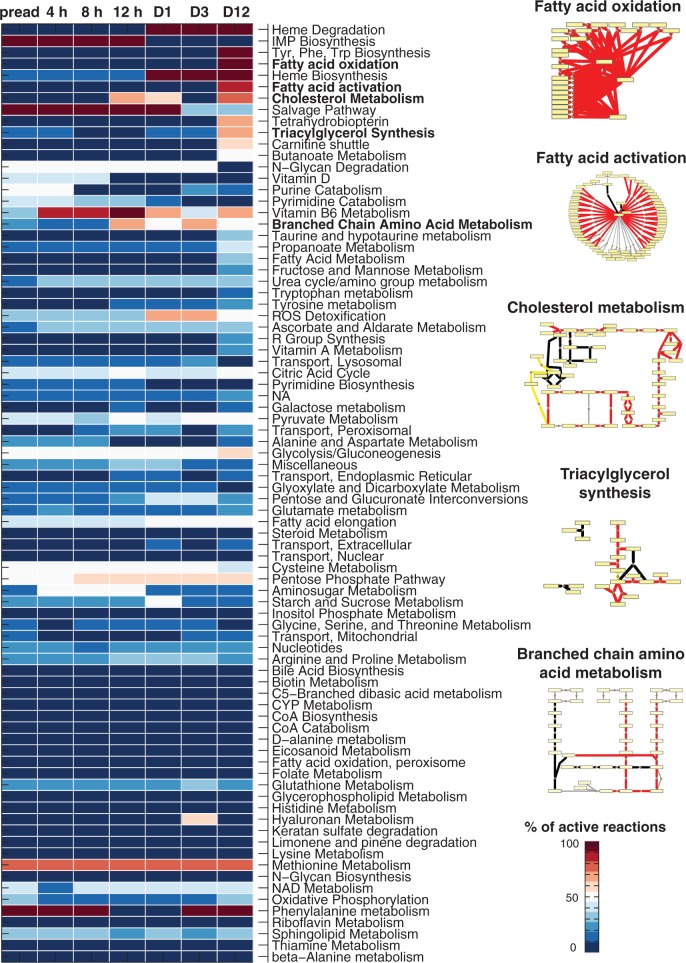
Figure 3.
Predicted metabolic activity changes during adipocyte differentiation and reaction backbones of selected pathways. A heatmap representing the predicted percentage of active reactions for each differentiation time point (columns) and metabolic pathway (rows) is shown for the Recon1 pathways (2). Blue color corresponds to no active reactions and red to complete activation. Notice that reactions can change between active and either inactive or undetermined. The pathways are shown in a descending order of activity considering the difference between preadipocytes (‘preadip’) and adipocytes (‘day 12’) and secondly alphabetically. Pathways highlighted (cholesterol metabolism, fatty acid activation and oxidation, triacylglycerol synthesis and BCAA metabolism) represent those with highest predicted activation with high prediction confidence score. The metabolic pathway backbones of these pathways are shown based on the stoichiometric information in the generic human metabolic model Recon1 (2). These pathways are predicted to shift to an active state in adipocytes compared with preadipocytes as indicated by the red edge color, yellow and black colors correspond to active or inactive reactions in both states, respectively. Yellow rectangular nodes represent metabolites and small orange diamonds represent reactions.

