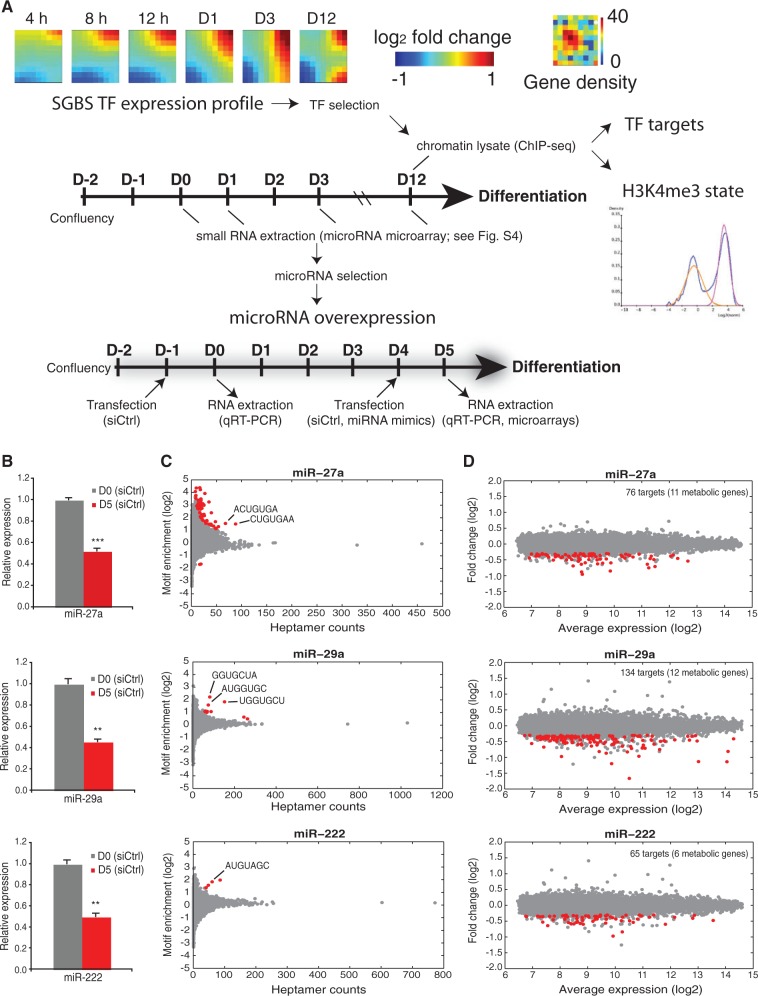
Figure 4.
Selection of regulatory molecules for further study. (A) The TF expression profile used to select the highest upregulated TFs during adipogenesis is visualized using GEDI maps (25) that cluster TF genes with similar expression profiles. The number of genes in each cluster is displayed in the Gene density panel beside. For the identification of their genome-wide targets, ChIP-seq samples were collected as indicated on day 12, including lysates used to assess the H3K4me3 chromatin marker status using TSS activity status mixture modeling. The schematic representation of the experimental procedure indicates the sample collection intervals for microarrays, miRNA microarrays and ChIP-seq. For the identification of primary target mRNAs of the selected miRNAs, a similar differentiation procedure was used, accompanied by transfections with miRNA mimics for miR-27a, miR-29a or miR-222 or scrambled siRNA as a control at day 4. Samples were collected 24 h after transfection for microarray and RT-qPCR analysis. (B) RT-qPCR analysis of the relative expression values of the endogenous miR-27a, miR-29a and miR-222 from undifferentiated and 5-day differentiated SGBS cells. The measured expression values were normalized to U47 snRNA and are shown relative to undifferentiated cells, value of which was set to 1 (gray bars). Data points indicate the mean expression values of triplicate experiments and the error bars represent SD. Student’s t-test was performed to determine the significance of downregulation on differentiation (*P < 0.05; **P < 0.01; ***P < 0.001). (C) Enrichment analysis of heptamer motifs in the 3′-UTR sequences of significantly downregulated transcripts. The count of all possible heptamer motifs (each represented by a circle) and their log2-enrichment within the 3′-UTRs of downregulated transcripts are depicted on the x-axis and y-axis, respectively. The significantly enriched heptamers are marked in red. The most enriched abundant heptamers are corresponding to the reverse complement sequences of the overexpressed miRNA seeds as indicated (see ‘Materials and Methods’ section for details). (D) MA-plot depicting the log2-expression levels (x-axis) of all transcripts in cells transfected with indicated miRNA mimics and the log2-fold change relative to cells transfected with siCtrl. The significantly downregulated transcripts (unadjusted P < 0.01, log2-fold change < −0.3) containing at least one putative binding site for the respective miRNA are marked in red. The total number of putative miRNA targets is indicated (with metabolic target genes in brackets).

