Figure 5.
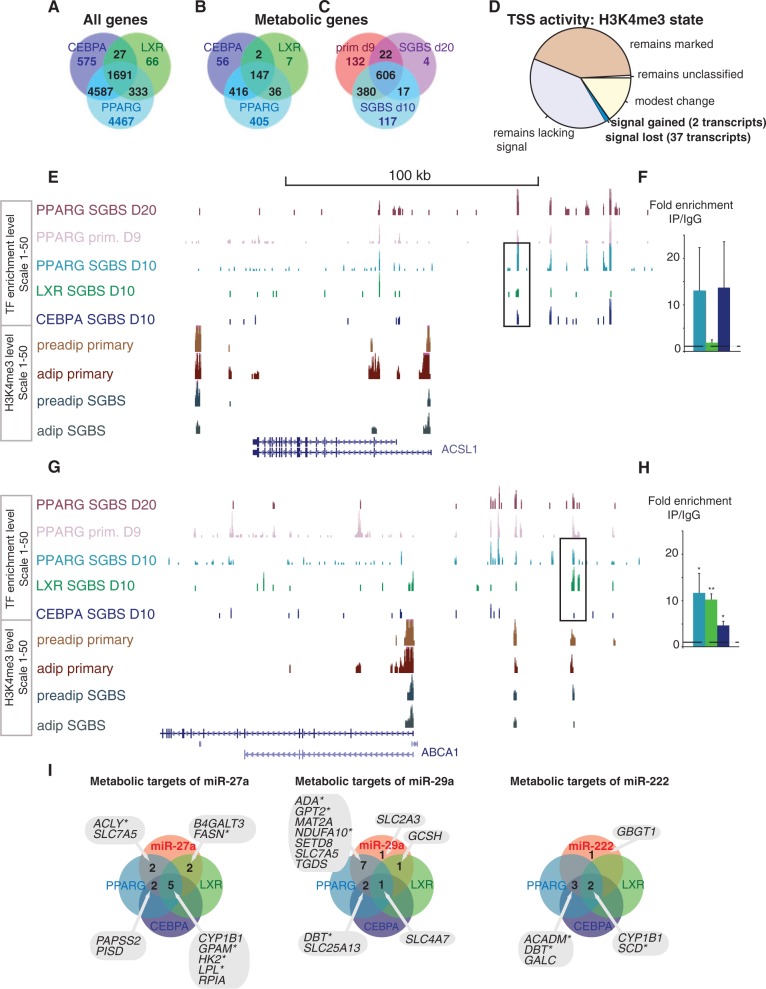
Overlaps in the genome-wide target profiles of PPARγ, CEBPα, LXR and the miRNAs −27a, −29a and −222 from SGBS adipocytes. Venn diagrams comparing putative target genes for PPARγ, CEBPα and LXR (in A and B) or between different studies that profile PPARγ binding (B) as obtained using the GREAT tool (36) are shown. Among all genes (A), 1691 genes are associated with all TFs, representing a large fraction from each individual TF peak-gene association list. Metabolic genes (C) show a similar highly overlapping target association profile. (C) In total, 606 PPARγ target associations to metabolic genes are supported by ChIP-seq data from day 10 and day 20 differentiated SGBS cells (41) and day 9 differentiated primary adipocytes (44), with an additional 419 metabolic genes supported by at least two data sets. The pie chart (D) illustrates how many genes gain or lose the H3K4me3 signal, showing that most genes retain their activity marker status. (E) The ChIP-seq signal tracks from PPARγ studies in SGBS cells (41) and primary adipocytes (44), CEBPα and LXR from SGBS adipocytes and H3K4me3 from primary and SGBS cells are displayed at the ACSL1 locus that shows high-occupancy binding of PPARγ, CEBPα and LXR. The ChIP-qPCR validation comparing enrichment with specific antibody to IgG unspecific control for the PPARγ and CEBPα occupied region indicated is shown in (F). (G) Similarly as above, the TF signal tracks show multiple peaks at the ABCA1 locus including the LXR response elements that show significant enrichment also with PPARγ and CEBPα antibodies as validated using ChIP-qPCR in (H). The enrichment values are shown relative to the enrichment of IgG and indicate the mean enrichment values of triplicate experiments and the error bars represent SEM. One sample t-test was performed to determine the significance of TF enrichment compared with IgG (*P < 0.05; **P < 0.01). (I) Venn analysis of metabolic target genes of the tested miRNAs and their targeting by TFs. The lists of metabolic genes targeted by the individual miRNAs and by the TFs PPARγ, CEBPα or LXR are overlapped to identify the metabolic genes under combinatorial multilevel regulation. The genes significantly changing during SGBS differentiation are indicated with a star.

