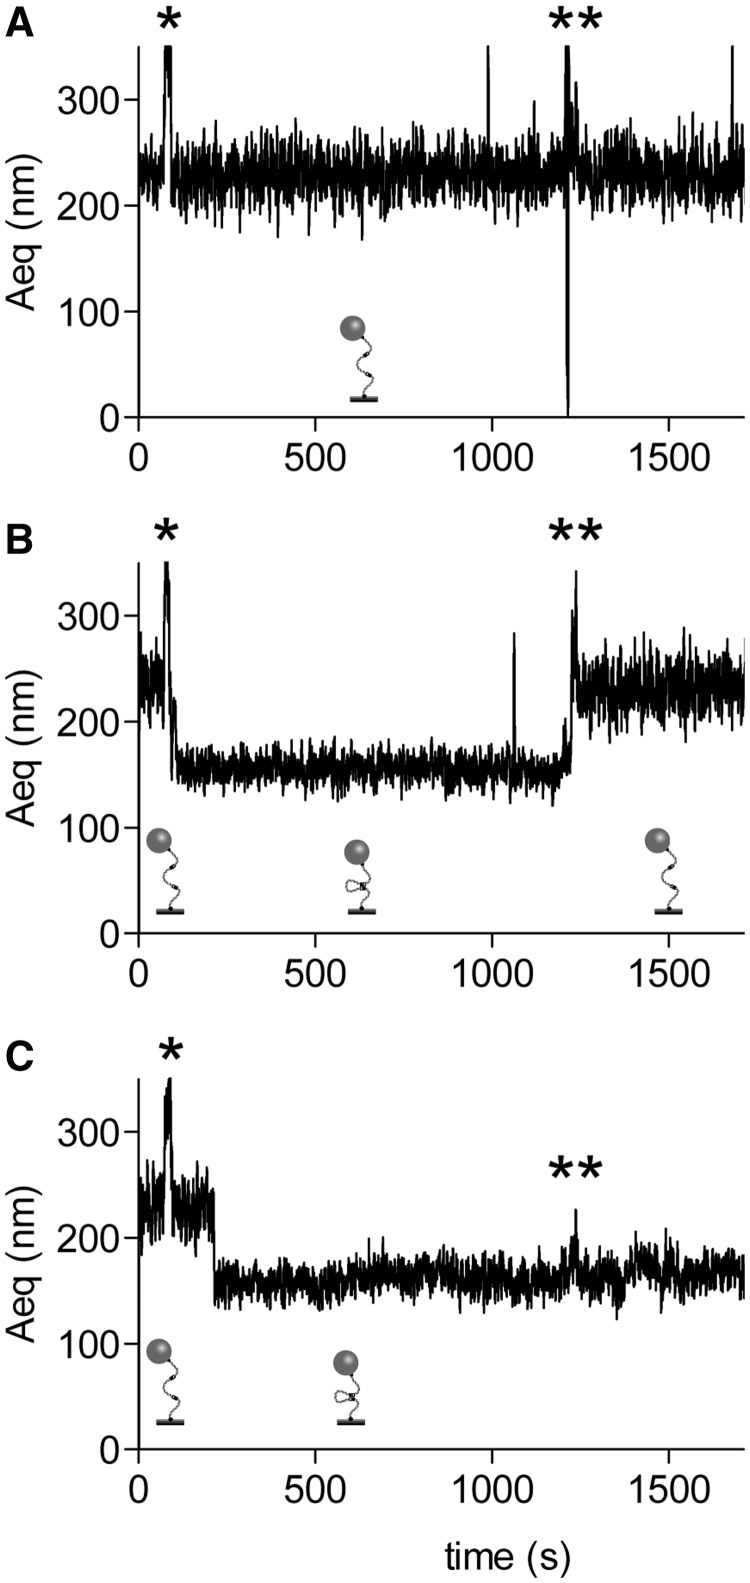
Figure 4.
Cre-loxP synapse formation and recombination. Typical traces (Aeq = f(time)) observed for non-synapsed (A), reversibly synapsed (B) and irreversibly synapsed (C) DNA molecules. Stars indicate the times of injection of Cre (*) and SDS (**). Schemes of the proposed structures of the DNA are shown underneath each trace.

