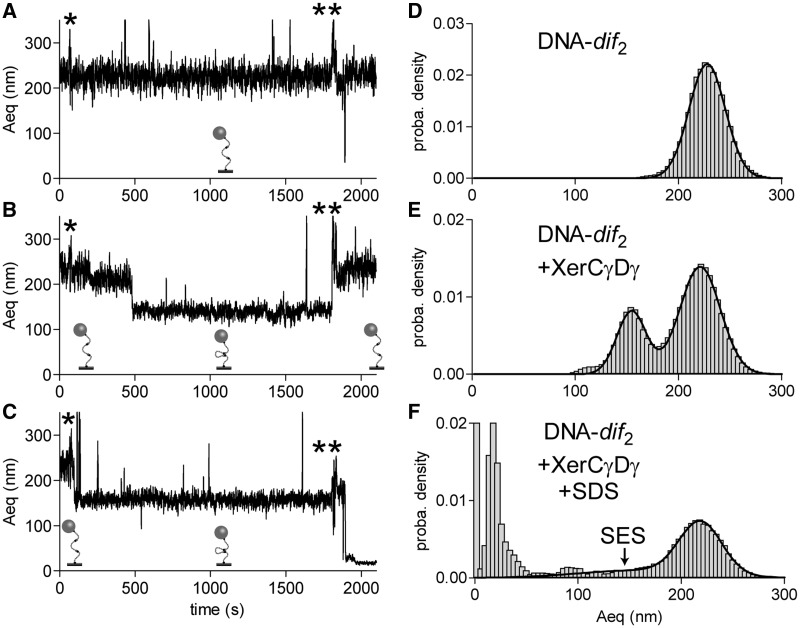
Figure 5.
XerCγDγ-dif synapse formation and recombination. (A–C) Typical traces (Aeq = f(time)) observed for non-synapsed (A), reversibly synapsed (B) and irreversibly synapsed (C). Stars indicate the times of injection of XerCγDγ mix (*) and SDS (**). Schemes of the proposed structures of the DNA are shown underneath each trace. (D–F) Probability distributions of Aeq before protein addition (D) during the 30 min following XerCγDγ mix addition (E) and after SDS injection (F). SES, for ‘strand exchange-synapse’, indicates the part of the curve corresponding to such events.

