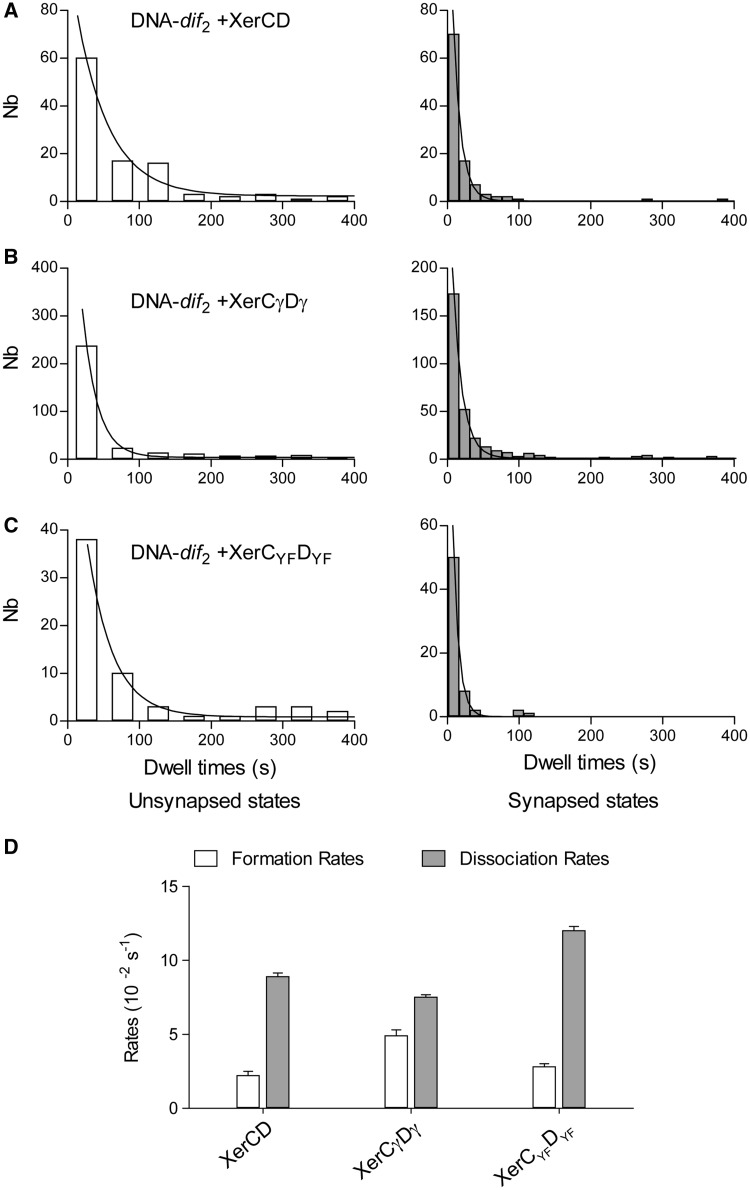
Figure 6.
Kinetics analysis. Histogram of the dwell times of unsynapsed states (left panel, white histograms) and of the synapsed states (right panel, grey histograms) measured for: (A) XerCD (N = 100); (B) for XerCγDγ (N = 123); and (C) for XerCYFDYF (N = 42). (D) The formation and dissociation rates were obtained by fitting the histograms of the duration of the unsynapsed and synapsed states with a monoexponential function (M&M).

