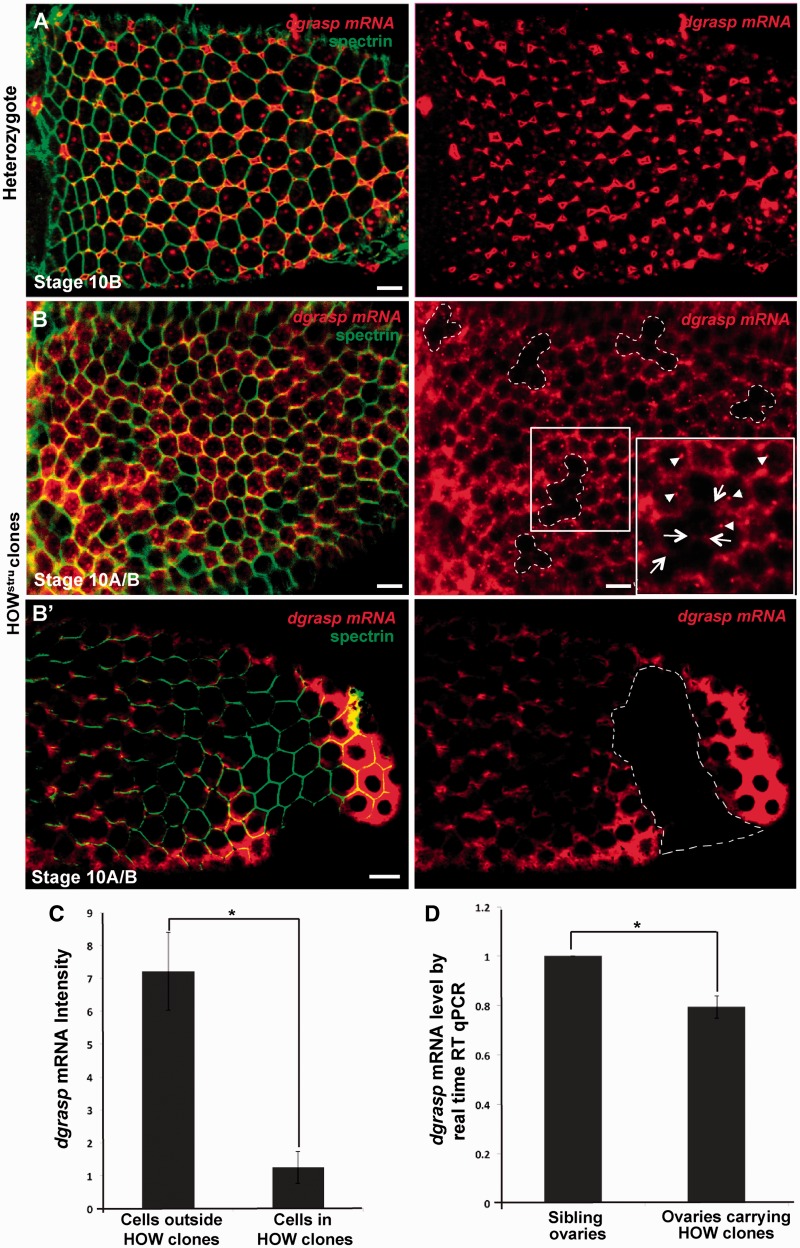
Figure 5.
HOW regulates the stability of dgrasp mRNA. (A–B′) En face view of the FISH localization of dgrasp mRNA (red) in the follicular epithelium at stage 10B of siblings non-expressing the flippase (n = 7 ovaries) (A), and these displaying HOWstru-3R-3 clones (outlined with dashed lines, n = 13 ovaries). The plasma membrane is outlined by immunolabelling with α-spectrin (green). (C) Quantification by imageJ of dgrasp FISH intensity in the HOW clones and the neighbouring cells. Bars indicate standard error. Fold change of dgrasp mRNA expression between control and HOWstru-3R-3 mutants is significant (n = 20, *P < 0.001). (D) Real-time RT–qPCR analysis of dgrasp mRNA levels in HOWstru-3R-3 mutant and control stage 10 single oocytes. Bars indicate standard error. The change in dgrasp mRNA levels between control and HOWstru-3R-3 mutants is significant *P < 0.001. Scale bars: 10 µm.

