Figure 4.
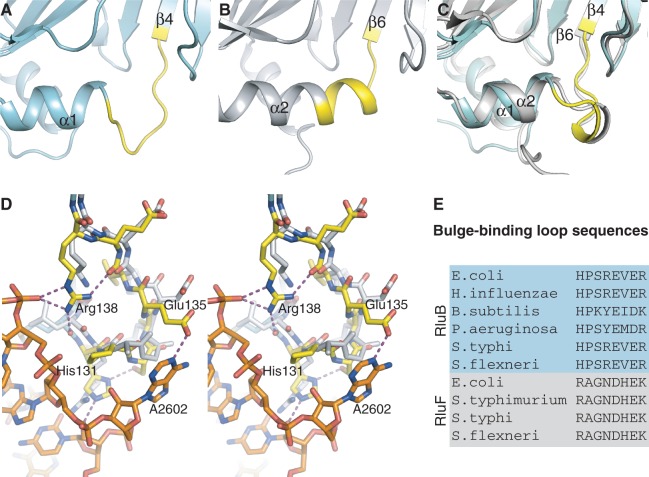
Comparison of the bulge-binding loop in RluB and RluF. (A) apo-RluB is colored blue–green and the bulge-binding loop (residues 131–138) is colored yellow. (B) apo-RluF in gray with analogous residues (128–135) colored yellow. (C) Superposed RluB and RluF in their RNA-bound conformations (RNA omitted for clarity). RluB is blue–green with its bulge-binding loop highlighted in yellow. RluF is gray. The loops have refolded to the same structure in the two RNA-bound complexes. (D) Stereo plot of the superposed RluB– and RluF–RNA complexes in the vicinity of the bulge (A2602). RluB is plotted with blue–green carbons and RluF with gray carbons. The bulge-binding loop in RluB is shown with yellow carbons and hydrogen bonds from this loop are shown as purple-dashed lines. (E) Aligned sequences of loop residues from several species of RluB and RluF.

