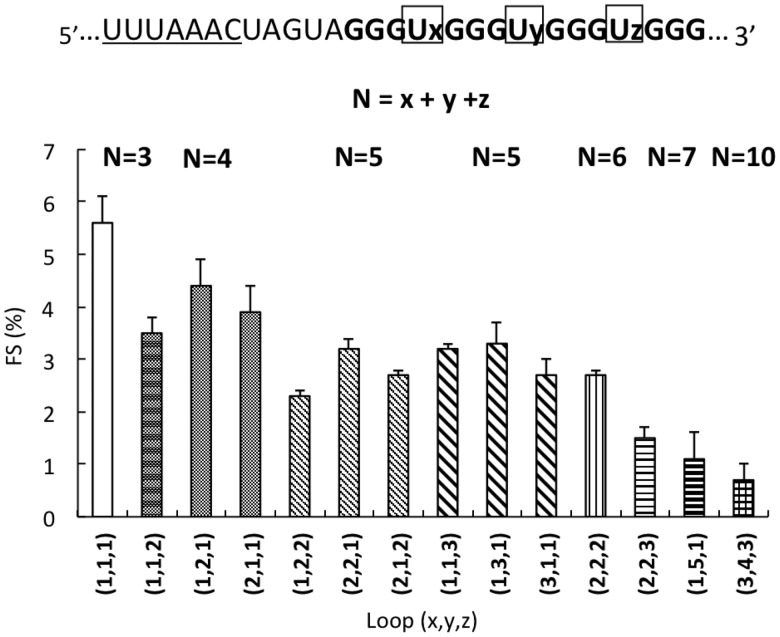
Figure 3.
Effect of loop length of RNA G4-induced −1 FS. The G4 sequence is composed of three loops denoted as x, y and z (from 5′ to 3′). N represents the sum of nucleotides in all three loops. The graph shows the results of −1 FS (indicated by bars, y-axis) induced by G4 with various loops {including different number of nucleotides at different positions [indicated by (x,y,z)] and total numbers (N, above the graph)}.

