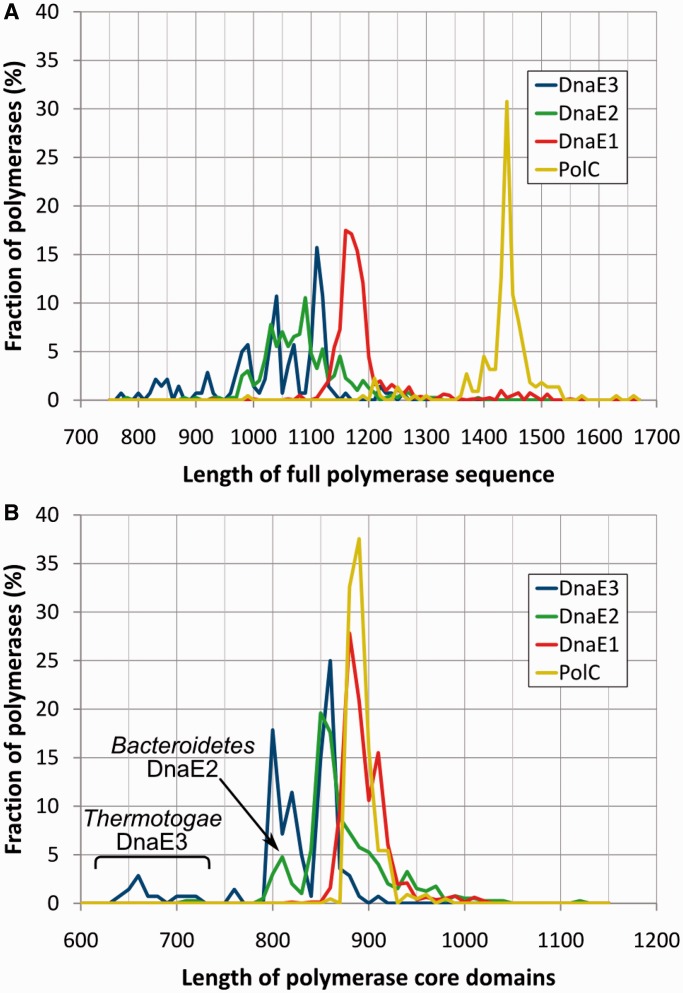
Figure 5.
Polymerase sequence length distributions in four distinct groups. Distributions for (A) full-length sequences and (B) only the core region [PHP, Pol3 and (HhH)2 domains; residues 6–889 of E. coli DnaE1]. The vertical axis indicates the fraction of polymerases in a given length interval (at the step of 10 residues) for each group separately. DnaE3 of Thermotogae and DnaE2 of Bacteroidetes have distinctly shorter core sequence regions than other polymerases in corresponding groups.

