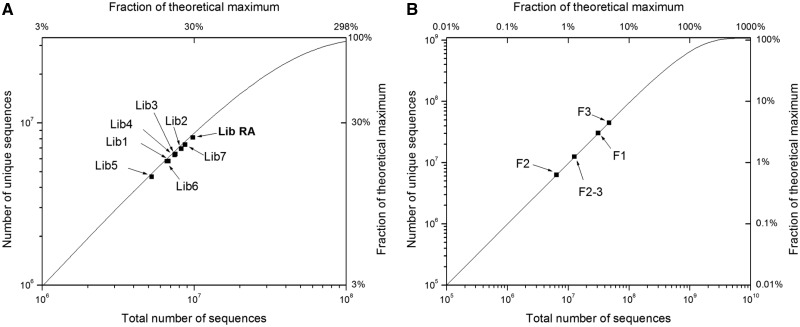
Figure 2.
Library diversity determined by deep sequencing. (A) The number of distinct sequences recovered as a function of the number of total sequences is shown for eight libraries with five random amino acids, with the RA library processed in this article bolded. The theoretical line is a depiction of Equation (1) in the main text representing the number of distinct sequences one would expect as sequencing depth is varied from a uniformly distributed pool of sequences. The fraction of the theoretical maximum that is represented by the number of sequences processed is shown at the top. (B) The number of distinct sequences recovered as a function of the number of total sequences processed is shown for four libraries with six random amino acids.

