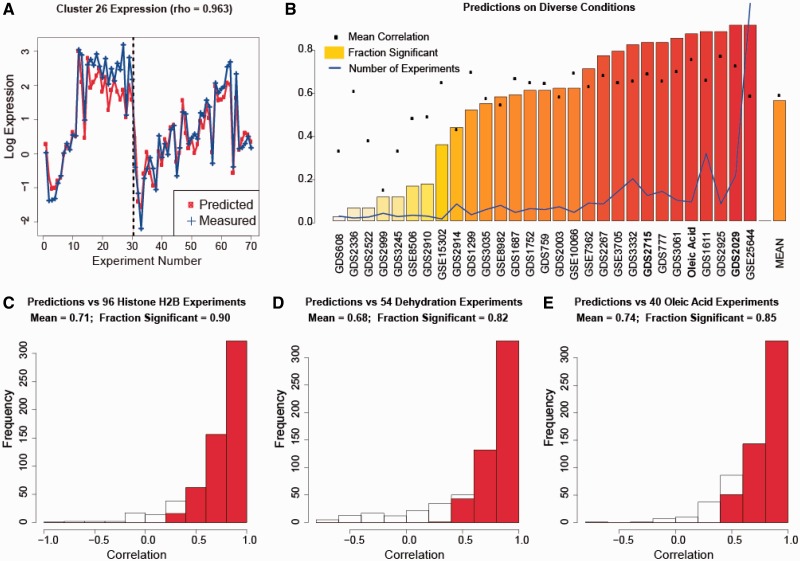
Figure 2.
Inferelator predicts gene expression across many unseen experimental conditions. Shown are Pearson correlation coefficients between the predicted and experimentally determined mRNA expression levels for the Level 1 yeast EGRIN. The biclusters were generated using 1516 mRNA expression experiments. (A) The predicted and actual mRNA expression levels for a cluster in the oleic acid data set. Experiments to the left of the dotted line consist of 30 yeast-in-glucose experiments from the 1516 training examples. Experiments to the right of the dotted line consist of 40 yeast-in-oleate experiments. (B) The average correlation and the fraction of statistically significant correlations for 27 experiment series not present in the training set. These sets are labeled with their GEO accession numbers. The blue line labeled ‘Number of Experiments’ shows the relative fraction of experiments for each experiment set. GSE25644 has the maximum number of experiments (464), thus its relative fraction is set to 1. (C), (D), and (E) show the correlation for three of these experimental series: (C) GDS2029, histone H2B mutations, (D) GDS2715, dehydration and (E) oleic acid exposure (peroxisome induction). Those correlations that are statistically significant ( ) are shown in red.

