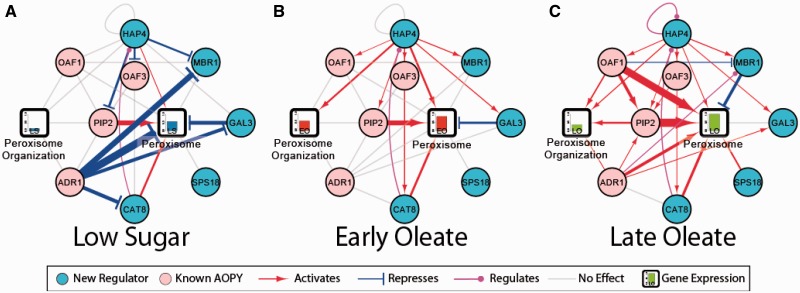
Figure 4.
New factors interact with known AOPY to regulate peroxisomes. Regulatory influences (edges) as revealed by two or more streams of evidence in (A) LS, (B) EO and (C) LO. Line thickness is determined by the average –log10 of quantile normalized P-values. The bars in the peroxisome GO blocks show the normalized average expression of genes with the ‘peroxisome’ and ‘peroxisome organization’ GO annotation in the wild-type genetic background at LS, EO and LO conditions.

