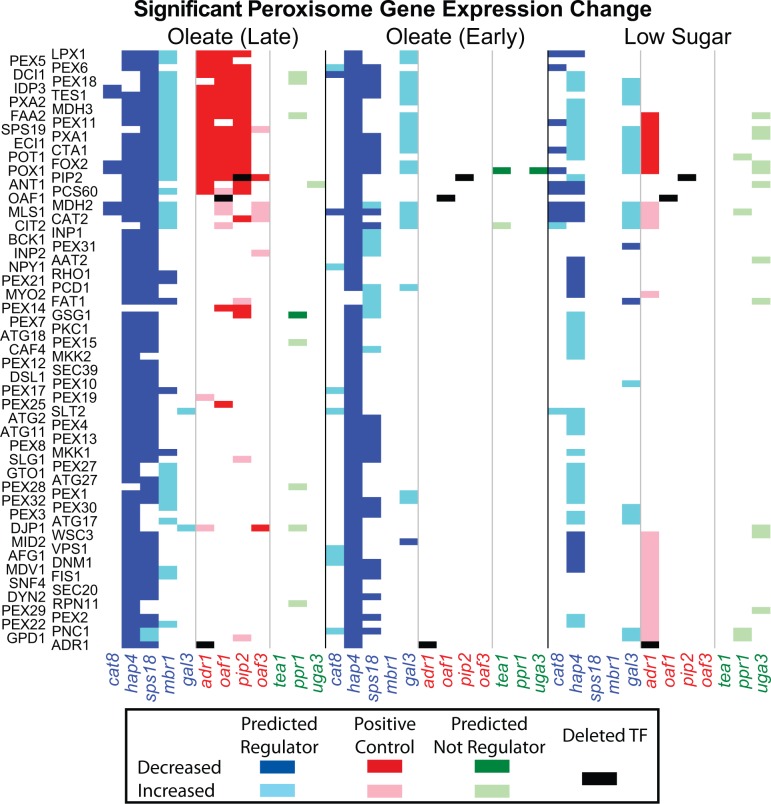
Figure 5.
Gene deletion experiments validate model. EGRIN-predicted regulation is compared with experimentally measured significant mRNA changes ( ) in corresponding TF deletion strains. The first five deleted genes (listed horizontally in red), the next four (in green) and the final three (in blue) are from those predicted to be regulators by the classifier, the positive control and those not predicted to be regulators by the classifier (respectively). mRNA levels were measured at 0.0 (LS), 0.5 (EO) and 5.0 (LO) h after oleate induction.

